

By Nicole L. K. Thiher and Julie L. P. Jessop, University of Iowa, and Sage M. Schissel, PCT Ebeam and Integration, LLC
Introduction
For photopolymerization, many methods exist to determine kinetic parameters, such as quantum yield of photoinitiators and rate of photoinitiation. However, due to the harsh conditions of the electron beam, relatively few studies have examined the kinetics of EB polymerization. Here, two new methods for determining rate of initiation and radiation yield (the number of radicals per 100 electron volts [eV] delivered) are presented, which will enable more detailed kinetic studies of EB polymerization.
The major difference in ultraviolet (UV) and electron beam (EB) polymerization lies within the initiation mechanism. In a generalized mechanistic description of free-radical UV initiation, a photoinitiator molecule (I) absorbs energy, which causes the photoinitiator to decompose into two primary radical species (R*). One or both radical species can then react with a monomer molecule (M) to form an activated monomer (M*) (Scheme 1)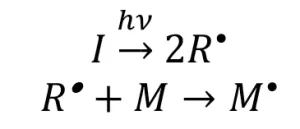
Scheme 1. The UV-initiation mechanism for free-radical polymerization. Adapted from Reference 1.
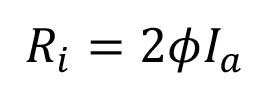
The resulting rate of initiation (Ri) is described by the following equation:
 (1)
(1)
where Ia is the intensity of absorbed light (moles of light quanta per liter second) and ϕ is the quantum yield (number of propagating chains initiated per light photon absorbed).
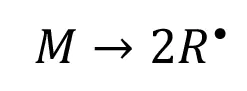
During EB initiation, ionizing radiation provides sufficient energy to generate primary radicals directly from the monomer molecules:
 (2)
(2)
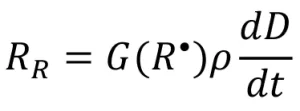
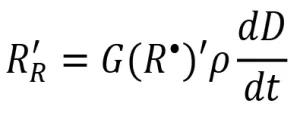
The resulting rate of radical formation (RR) is described by the following equation:
 (3)
(3)
where G(R•) is the primary radical radiation yield (number of primary radicals created by 100 eV of energy absorbed by the system), is the density of the system (g/mL), and ![]() is the dose rate (kilogray, or kGy). Different monomer chemistries are expected to have different radiation yields, or G-values, when exposed to EB, just as photoinitiators have unique quantum yields.
is the dose rate (kilogray, or kGy). Different monomer chemistries are expected to have different radiation yields, or G-values, when exposed to EB, just as photoinitiators have unique quantum yields.
Unlike photoinitiated systems, the primary radicals generated by EB often undergo further reactions, including: recombination (reaction of two primary radicals to form a small molecule), initiation (reaction of a primary radical and a monomer molecule to form a growing polymer chain), crosslinking (reaction of two primary radicals on the backbone of a growing polymer chain P – R* to form a network connection X), or termination (reaction of a primary radical and a growing polymer chain to form a dead polymer Pn). Other primary radicals will be inherently inert or trapped by the forming network and will not undergo further reactions (Scheme 2).
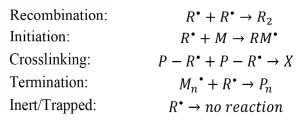
Scheme 2. Possible reactions of primary radicals formed during EB initiation. Adapted from Reference 3.
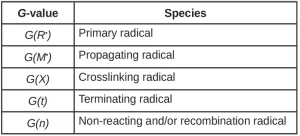
Similar to the primary radical radiation yield, each of these possible reactions can be defined in terms of a radiation yield. In general, G(A) is the number of species A created or destroyed per 100 eV of energy absorbed by the system (Table 1). In literature, the G-value has been used to define and quantify a wide variety of radiation-induced events from scission and grafting to ionization and gas evolution.
Because the primary radicals can react in many ways, simply calculating the total number of primary radicals does not completely describe the complex system. Thus, the primary radical radiation yield can be described as the sum of the radiation yields of all possible primary radical reactions, as shown in Equation 4.
![]() (4)
(4)
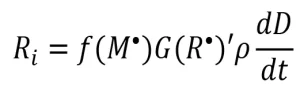
If all the primary radicals further react with monomer molecules to initiate polymerization [i.e., G(R*)=G(M*)], then the rate of initiation (Ri ) can be expressed as
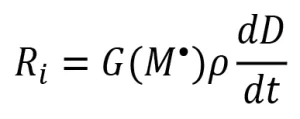 (5)
(5)
The assumption G(R*) = G(M*) is often made, and Equation 5 is used to describe the rate of initiation of EB polymerization. However, during a typical EB polymerization, all the reactions portrayed in Scheme 2 take place, and Equation 5 may not be valid.
To further complicate the matter, measuring the concentration of radicals directly is very difficult. The number of radicals is often determined by adding a compound that will react with any radicals in the system, and that is easily measured via spectroscopy or another analytical technique. This method for determining radical concentration will only count the reactive radicals, and the yield that is measured is the apparent primary radical radiation yield G(R*)’:
![]() (6)
(6)
The apparent primary radical radiation yield only accounts for the radicals that are important to polymerization and network formation.
The fraction of propagating radicals [ f(M*)], crosslinking radicals [ f(X)] and terminating radicals [ f(t)] can be determined from the ratio of the G-value of the desired fraction over the apparent radiation yield. For example, see Equation 7.
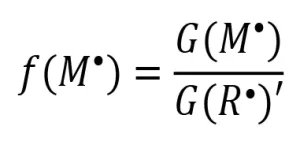 (7)
(7)
As these three f-values account for all the measurable radicals formed by the EB, their sum is one (Equation 8).
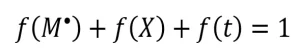 (8)
(8)
These f-values provide insight into network formation and can be used to relate the apparent radiation yield to the rate of initiation as follows in Equation 9:
 (9)
(9)
Despite the ability to derive what radiation yield values are important in understanding EB initiation, determining these G-values for EB-initiated polymer systems has proven difficult. After an extensive literature search, the G(R*)’ values of only a handful of continuous EB-initiated monomer chemistries have been found.2,9-11 One method used to determine G(R*)’ relies on building a kinetic profile (conversion vs. time), calculating the resulting gel fraction and determining of the number-averaged degree of polymerization (Xn).9 Not only does this method require multiple experiments, it is also necessary to make numerous assumptions about network formation, rate of polymerization and termination that may not be appropriate for all systems. As a result, it is desirable to develop a new method to determine G(R*)’ and/or G(M*) for EB reactions that is easier to implement and can be used for any monomer that polymerizes via the free-radical mechanism.
Other methods for determining G -values have been developed for gamma-initiated systems, but these methods have not been implemented for EB-initiated systems.Because gamma-initiated polymerizations typically take place at dose rates that are orders of magnitude lower than those used for EB polymerization, not all methods used for gamma-initiated systems can easily be adapted to EB initiation. Furthermore, in the gamma-initiated polymerization literature, G(M*) , G(R*), and G(R*)’ are not carefully defined, and the different G -values are often used interchangeably. Modification to select methods will allow distinct G -values to be determined for EB-initiation.
Determination of the radiation yields and investigation of the kinetics of EB polymerization will help develop formulation chemistry/processing conditions/polymer properties relationships that are lacking in EB-initiated systems. Here, two methods are developed, one to determine G(R*)’ and a second to determine G(M*). Comparing the G -values resulting from these methods provides insight into the number and types of radicals that are formed during EB exposure.
Experimental
Materials
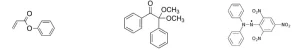
The monomer phenyl acrylate (PA, TCI America) was chosen to investigate the radiation yield during EB initiation. Experiments carried out under UV irradiation were photoinitiated by 2,2-dimethoxy-2-phenylacetophenone (DMPA, Sartomer). If an inhibitor was required for the experiment, 2,2-diphenyl-1-picrylhydrazyl (DPPH, TCI America) was used. Finally, the solvent used in the experiments was tetrahydrofuran (THF, Aldrich). THF was filtered through 0.2 μm nylon filter disks (Cole Parmer) and degassed before use. All other materials were used as received and stored at room temperature.
Methods
Protocol 1 – Measuring G(R*)’
Sample Preparation. Formulations of PA with 2% DPPH by weight were prepared and sonicated for 60 minutes. This concentration of DPPH was larger than the concentration of radicals created by the EB to ensure that all of the radicals could react with the inhibitor. After sonication, 100 μL of the formulation was pipetted into aluminum weigh dishes with an 11 mm diameter. The aluminum weigh dishes were secured to Q-panels for easy transport and EB exposure.
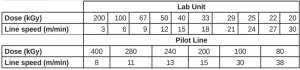
Electron-Beam Exposure. EB exposure was performed on two different EB units to check for differences in the equipment. An EBLab unit (Comet Technologies, Inc.) and an EB Pilot Line (BroadBeam EP Series, PCT Ebeam and Integration, LLC) were used. The voltage was set at 200 kV, and nitrogen flow was used to reduce the oxygen concentration to less than 200 ppm to minimize the effects of oxygen inhibition. Up to 10 exposure conditions were used for these experiments, all at a consistent dose rate of 197±4 kGy/s. Each Q-panel held three aluminum weigh dishes and was exposed to a unique dose of radiation, while the dose rate was held constant by controlling the line speed. The dose and line speed combinations used for both EB units in this experiment are shown in Table 2.
UV-Vis Analysis. After polymerization, 10 μL of sample from each aluminum weigh dish and 1,000 μL of acetone were pipetted into a cuvette with a path length of 1 cm. The absorbance of each sample was measured at 525 nm using a DU-62 Spectrophotometer (Beckman).
Protocol 2 – Measuring G(M•)
Raman Spectroscopy of EB samples. Pure PA was prepared for EB exposure using the sample preparation described in Protocol
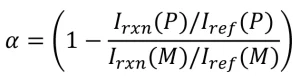
1. After polymerization on the EBLab unit, using the dose and line-speed combinations listed in Table 2, the EB samples were transferred to quartz capillary tubes, and Raman spectroscopy was used to determine the conversion. To eliminate error from instrumental variations, a reference peak was used. Previous work has established the reaction peak at 1,636 cm-1 (indicative of the C=C- bond in the acrylate moiety) and the reference peak at 1,613 cm-1 (indicative of the -C=C- bonds in the phenyl ring). Conversion was calculated using the following equation:
 (10)
(10)
where Irxn (P) and Iref (P) are the peak intensities of the reaction and reference peak of the polymer, respectively; Irxn (M) and Iref (M) are the peak intensities of the reaction and reference peak of the monomer.
Raman spectra of the samples were collected using a holographic probe head (Mark II, Kaiser Optical Systems, Inc.) connected to a modular research Raman spectrograph (HoloLab 5000R, Kaiser Optical Systems, Inc.) via a 100-μm collection fiber. A single-mode excitation fiber carried an incident beam of 785 nm near-infrared laser to the quartz capillary tube. Laser power at the sample was approximately 180 mW. Spectra were collected with an exposure time of 250 ms and 5 accumulations. Ten monomer and sample spectra were collected and averaged to provide accurate values for Equation 10, and conversions were reported.
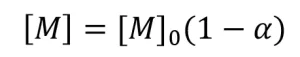
Real-Time Raman Spectroscopy of UV Samples. Formulations of PA containing five different concentrations of the initiator DMPA (0.1%, 0.2%, 0.3%, 0.4%, and 0.5% by weight) were created and pipetted into capillary tubes. Real-time Raman spectroscopy was used to monitor conversion during illumination with a mercury arc lamp fitted with a 250 to 450 nm filter (Omnicure Ultraviolet/Visible Spot Cure system, EXFO Photonic Solutions, Inc.) for 30 seconds at an effective irradiance of 1.74 W/cm2 as measured with a radiometer (R2000, Omnicure, wavelength range 250 nm to 1 μm). Spectra were acquired using the same set-up as described for the EB samples. The spectra were collected with 0.5 second exposure time and one accumulation during illumination. Ten monomer spectra were collected before illumination and averaged to provide accurate values for Equation 10. After illumination, conversion was calculated using Equation 10. The conversion data were used to calculate the rate of polymerization (Rp), which is equal to the rate of disappearance of monomer ![]() . The instantaneous concentration of monomer ([M]) was determined using the following equation:
. The instantaneous concentration of monomer ([M]) was determined using the following equation:
 (11)
(11)
where [M]0 is the initial monomer concentration. A linear best-fit line was drawn through the data points. The absolute value of the slope of the best fit line is equal to Rp.
Gel Permeation Chromatography (GPC) of UV Samples. The same formulations of PA and initiator used for real-time Raman analysis were used for GPC analysis. Glass slides were coated with two layers of Rain-X®, glass cover slips were placed on each side of one glass slide to act as a spacer, a second glass slide was placed on top of the cover slips such that the Rain-X coated sides were both facing inward, and the mold was clamped together with binder clips on each end. Each mold was injected with one of the five formulations of PA containing DMPA. The samples were illuminated with a UV belt lamp system (Fusion UV Systems, Inc.) equipped with a mercury arc lamp with an effective irradiance of 1.7 W/cm2. After illumination, the films were removed from the molds and transferred to vials that were filled with tetrahydrofuran (THF) and allowed to dissolve for 48 hours. Finally, the samples were filtered through No. 1 filter paper (Whitman).
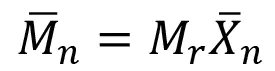
The filtrate was injected through a 20-μL loop, and THF pushed the sample through the GPC system at a flow rate of 1.0 mL/minute. The sample was fractionated by a PL-gel 5μm mixed-D column (Agilent, Inc.) before multi-angle light scattering analysis (DAWN HELEOS-II, Wayatt Technology) and refractive indexmeasurements (Optilab T-Rex, Wayatt Technology) were performed. Data analysis gave the number-averaged molecular weight Mn, which was used to determine Xn via the following equation:
 (12)
(12)
where Mr is the molecular weight of the repeat unit.
Results and Discussion
Protocol 1 – Measuring G(R*)’
Protocol 1 was adapted from a method to determine what was referred to as the G(R•) of monomers initiated with gamma radiation. However, the protocol actually measures what has been defined in this paper as G(R*)’. In Protocol 1, inhibitor DPPH was added to the formulations to react with primary radicals. When DPPH reacts with a primary radical, a color change occurs that can be measured using UV-Vis spectroscopy. According to Beer’s Law, this color change is proportional to the change in concentration of DPPH. A calibration curve was built to determine the concentration of DPPH in a sample from the measured absorbance. Because each molecule of DPPH reacts with one radical, the rate of is appearance of DPPH is equivalent to the apparent rate of radical formation (RR‘). The apparent radiation yield G(R*)’ was then calculated according to the following equation.
 (13)
(13)
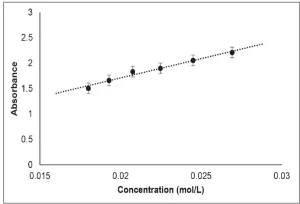
Calibration Curve
Mixtures of PA containing between 0.015 and 0.03 mol/L DPPH were formulated to build a calibration curve. The absorbance of each formulation with known concentration was measured at 525 nm, the wavelength at which DPPH exhibits maximum absorption. Absorbance (A) was plotted as a function of DPPH concentration ([DPPH]), and the resulting best fit line, from the average of three trials, was determined to be A=81.084 [DPPH] + 0.1513 (Figure 2).
Apparent Rate of Primary Radical Formation
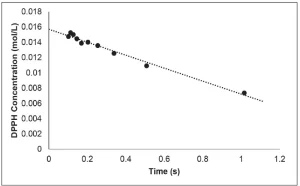
After calculating the concentration of DPPH for all samples using the UV-Vis calibration curve, the rate of disappearance of DPPH was determined. The concentration of DPPH was graphed as a function of EB exposure time, which is calculated from the line speed and EB window width using the following equation:
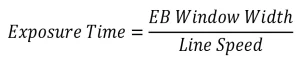 (14)
(14)
The slope of the resulting best fit line is equal to the rate of disappearance of DPPH (Figure 3). This procedure was repeated three times, and the resulting rate of disappearance of DPPH was 0.0080±0.0005 mol/L⋅s. Because each molecule of DPPH reacts with one radical, the rate of disappearance of DPPH is equal to the apparent rate of primary radical formation.
Apparent Primary Radical Radiation Yield G(R*)’
Equation 13 was used to calculate G(R*)’ from the apparent rate of radical formation. Because numerous unit conversions are necessary, a sample calculation is provided and explained here:
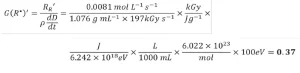
First, the dose was converted from kGy to the SI units J/g. A second conversion was used to transform the energy from J to eV. The volume units in the density term were converted from mL to L. Next, Avogadro’s number was used to convert from a molar basis to a radical basis. Finally, the answer was multiplied by 100 eV so that the reported value would be consistent with the definition of radiation yield. Three trials were conducted on each EB unit, and the resulting G(R*)’ values and standard deviation of PA are reported in Table 3. The average G(R*)’ values resulting from the three trials was 0.37±0.02 using the EBLab unit and 0.38±0.01 for the Pilot Line.
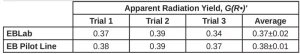
There is no statistical difference between the G(R*)’ values of PA gathered using the EBLab unit vs. the EB Pilot Line. Furthermore, the error on both EB units is similar. These results indicate that G -values are not dependent on the EB unit or total dose used to perform the polymerization as long as the dose rate is consistent.
Protocol 2 – Measuring G(M*)
Protocol 2 was adapted from a method to determine quantum yield of initiators during photopolymerizations. In Protocol 2, the propagating radical radiation yield, G(M*) , was calculated from Equation 5. To determine the Ri value necessary for this calculation, a ratio of the kinetic constants of propagation (kp ) and termination (kt), as well as the rate of EB propagation (RP ), are needed.
Kinetic Constants in Photopolymerization
The typical method to determine the kinetic constants of a photopolymerization requires samples to be polymerized using different concentrations of photoinitiator, which result in different values of Rp and Xn . Because there is no initiator used for EB polymerizations, it is difficult to alter Rp and Xn without changing the formulation or processing conditions. For this reason, the kinetic constants of termination and propagation for this experiment were determined using photopolymerization. Because the propagation and termination steps of EB and UV polymerizations are thought to be the same, the kinetic constants of propagation and termination are also assumed to be the same for both initiation mechanisms. The ratio of the kinetic constants can be related to Rp , Xn , and a constant for chain transfer to the monomer (CM) as follows:
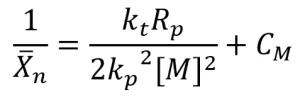
(15)
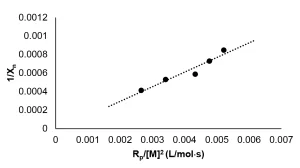
Rp was calculated from real-time Raman data, and Xn was calculated from GPC data. A graph of ![]() is shown in Figure 4. A linear best fi t line was drawn though the data points, resulting in a slope of 0.031 mol⋅ s/L, which is equal to
is shown in Figure 4. A linear best fi t line was drawn though the data points, resulting in a slope of 0.031 mol⋅ s/L, which is equal to ![]() . Thus, the ratio of the kinetic constants
. Thus, the ratio of the kinetic constants ![]() needed to calculate the rate of EB polymerization was determined to be 0.062 mol⋅ s/L.
needed to calculate the rate of EB polymerization was determined to be 0.062 mol⋅ s/L.
Rate of EB Polymerization
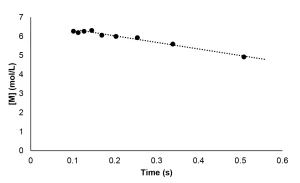
Because real-time Raman measurements are not possible during EB polymerization, the kinetic profile could not be constructed in the same manner as described for the photopolymerization experiments. Instead, the conversion was determined for individual samples that received increasing doses of radiation. The kinetic profile was then pieced together from the conversion measurements of successive experiments. Once the kinetic profile was constructed, the method to determine Rp was followed from the photopolymerization experiments. The instantaneous concentration of monomer was determined using Equation 11, and Rp was calculated as the absolute value of the slope of the best fit line. The disappearance of monomer as a function of time for the EB polymerization reaction is shown in Figure 5. A linear best fi t line was drawn through the data points with greater than 5% conversion and averaged from three trials. Thus, Rp for the EB polymerization of neat PA was determined to be 2.5 mol/L⋅ s.
Propagating Radical Radiation Yield G(M*)
Assuming radical formation reaches steady state, Equation 16 can be used to determine the rate of EB initiation as follows:
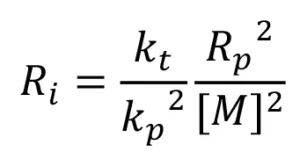 (16)
(16)
Equation 16 was used to calculate Ri , and from that, G(M*) was calculated using Equation 5. Three trials were conducted, and the resulting G(M*) values are reported in Table 4.
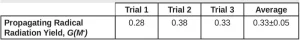
The average G(M*) value resulting from the three trials was 0.33 ±0.05. Using Equation 7, the fraction of propagating radicals [ f(M*) ] is 0.89. EB reactions often result in highly cross-linked polymer, so not all of the primary radicals are expected to initiate polymerization. However, Equation 5 is used to calculate G(M*) and is only valid if all the primary radicals react with monomer to become propagating radicals, which is not the case for EB-initiated polymerizations. Furthermore, it was assumed that the kinetic constants of EB polymerization were the same as those for photopolymerization. Because EB initiation typically results in more highly crosslinked polymers, this assumption may not be accurate. Despite these assumptions, as expected, the resulting G(M*) value is lower than the value of G(R*). In future work, it would be ideal to find a method to calculate G(M*) without the assumptions needed in Protocol 2, but these protocols provide a good starting point.
Conclusions
Protocols have been developed to determine the apparent primary radical radiation yield G(R*)’ and the propagating radical radiation yield G(M*) for EB-initiated polymerizations. For the monomer in this study, results show that 89% of the primary radicals further react to initiate polymerization. Using these protocols, G-values of different monomers can be calculated to determine how monomer chemistry impacts radical formation. Determining the G-values of different monomers and calculating the fraction of radicals that go on to initiate polymerization will provide insight into the kinetics of EB polymerization. These G -values can be used to help develop the structure/processing conditions/properties relationships that are currently lacking for EB polymerization.
Acknowledgements
This material is based upon work supported by the National Science Foundation under Grant No. 1264622 and The University of Iowa Mathematical & Physical Sciences Funding Program. The authors would also like to acknowledge Kyle McCarthy and Renae Kurpius for their contributions to data collection.
References
- Odian, G., Principles of Polymerization, fourth ed. John Wiley & Sons, Inc.: New Jersey, 2004.
- Chapiro, A., Radiation Chemistry of Polymeric Systems. John Wiley & Sons, Inc.: New York, 1962.
- Richter, K.B., Pulsed Electron Beam Curing of Polymer Coatings. Proquest: Michigan, 2007.
- ICRU Report 33, 1980. Radiation Quantities and Units, International Commission on Radiation Units and Measurement: Washington D.C., pp. 25
- Abraham, R. J., Whiffen, D. H., 1957. Electron Spin Resonance Spectra of Some γ-irradiated Polymers, Trans. Raraday Soc. 54, 1291-1299
- Ohnishi, S. I., Ikeda, Y., Kashiwagi, M., Nitta, I., 1961. Electron spin resonance studies of irradiated polymers I. Factors affecting the electron spin resonance spectra of irradiated polymers, Polym. 2, 119-141
- Fessenden, R. H., 1964, Measurement of Short Radical Lifetimes by Electron Spin Resonance Methods. J. Phys. Chem., 68(6), 1508-1515
- Wilson, J. E., 1974. Radiation Chemistry of Monomers, Polymers, and Plastics. Marcel Dekker, Inc.: New York
- Labana, S.S., Kinetics of high‐intensity electron‐beam polymerization of a divinyl urethane. J. Polym. Sci. Part A-1: Polym. Chem. 6(12), 1986, pp. 3283–3293.
- Squire, D. R., Cleaveland, J. A., Hossain, T. M. A., Oraby, W., Stahel, E. P., and Stannett, V. T., Studies in Radiation-Induced Polymerization of Vinyl Monomers at High Dose Rates. I. Styrene. J. Appl. Polym. Sci. Vol 16, 1972, pp. 645-661.
- Allen, C. C., Oraby, W., Hossain, T. M. A., Stahel, E. P., Squire, D. R., and Stannett, V. T., Studies in Radiation-Induced Polymerization of Vinyl Monomers at High Dose Rates. II. Methyl Methacrylate. J. Appl. Polym. Sci. Vol 18, 1974, pp.709-725.
- Schissel, S.M., Lapin, S.C., Jessop, J.L.P., Internal reference validation for EB-cured polymer conversions measured via Raman spectroscopy. RadTech Rep. 28(4), 2014, pp. 46–50.
- Cai, Y., Jessop, J.L.P., Decreased oxygen inhibition in photopolymerized acrylate/epoxide hybrid polymer coatings as demonstrated by Raman spectroscopy. Polym. 47(19), 2006, pp. 6560–6566.
Nicole L. K. Thiher is working to understand and expand the use of electron-beam polymerization as she pursues a doctorate in chemical engineering at the University of Iowa. Julie L. P. Jessop, previously a fauclty member at the University of Iowa, is now a professor, associate director and Hunter Henry Chair at the Dave C. Swalm School of Chemical Engineering at Mississippi State University. Sage M. Schissel, previously a graduate research and teaching assistant at the University of Iowa, is an applications specialist at PCT Ebeam and Integration, LLC, Davenport, Iowa.


