Seventy-one years ago, the headline (Dewey Defeats Truman) in the Chicago Daily Tribune incorrectly identified the winner of the 1948 presidential election. Was this a result of poor data or poor sampling? Fast forward to 2019, and voters in the United States are being barraged with endless polls, phone calls and surveys in order to predict the outcome of our elections. What do these two events have to do with UV measurement and process control?
Question: How does the sample rate of a radiometer impact the collected and reported data?
Answer: This month’s answer is broken into two parts.
Part one: The ability to accurately and repeatedly measure a UV source depends, in part, on the radiometer’s ability to gather and store an adequate number of observations (samples) under the UV source.
The precise peak irradiance of a UV source occurs for only a brief instant. Accurately measuring the peak irradiance (W/cm2) requires an adequate number of samples, regardless of whether it is a UV broadband (mercury) or LED source. In the case of a broadband source, the area of peak irradiance in a focused UV system usually corresponds to the bulb diameter – typically 0.35 to 1.02″ (9 to 26 mm). An LED consists of multiple sources of irradiance, and manufacturers work hard to make sure the output across the array is uniform.
The accurate calculation of the energy density (J/cm2) relies on recording and integrating multiple irradiance values under the entire source.
An effective radiometer sample rate of 25 Hz (samples per second) was state of the art 30 years ago. This effective sample rate placed a “speed limit” of 40 feet (or 12 meters) per minute on the radiometer to allow the instrument to gather enough samples to “catch” the peak irradiance. Exceeding an instrument’s data collection “speed limit” risked missing the true peak irradiance and could cause wide variations in the peak irradiance value.
Today’s technology allows radiometers to sample at extremely high rates (e.g., >30,000 Hz). Through the use of electronic/data (not optical) filters, effective (equivalent) sample rates ranging from 128 to 2048 Hz can be set by the user.
Faster sampling rates provide greater resolution, especially as the speeds of some applications (digital printers) approach 500 to 600 feet (150 to 180 meters) per minute. The ability to collect data at faster production speeds does not mean it always is practical. Common sense dictates the need to place, secure and retrieve a radiometer from the process without causing damage to the equipment, instrument or the person taking the measurements.
Part two: What happens when I collect data at a fast sample rate?
Part One discussed the sample rate of the radiometer. Part Two deals with how to properly interpret the data collected.
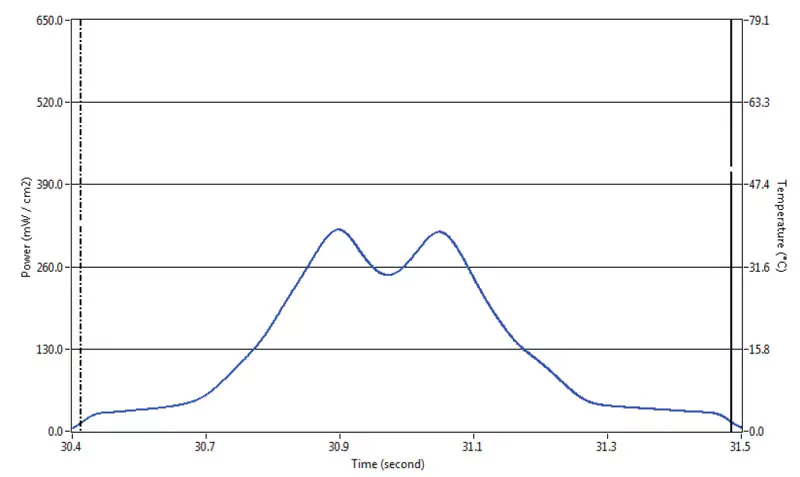
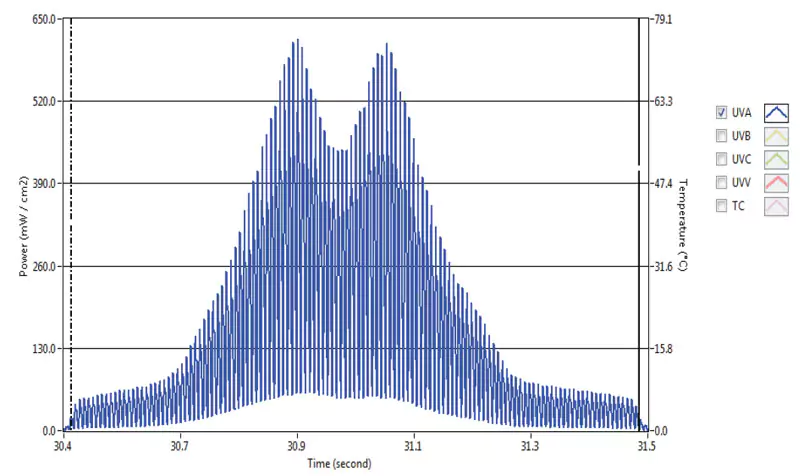
Figures 2 and 3 show data for a single non-focused UV lamp, collected under identical conditions except for the effective sample rate of the radiometer. Only the UVA (EIT 320 to 390 nm) is shown; the X axis is time and Y axis is UV irradiance.
The data in Figure 2 were collected at an effective sample rate of 128 Hz. The peak irradiance is 318.3 mW/cm2, and the energy density is 139.9 mJ/cm2. The irradiance values and profile show the average peak or RMS intensity.
The data in Figure 3 are of the same source measured at an effective sample rate of 2048 Hz. The peak irradiance in this example is 618.0 mW/cm2 and the total energy density is 139.9 mJ/cm2. There is a 94% difference in the peak irradiance value, while energy density values have remained the same. The irradiance values and profile shown are often referred to as the instant peak.
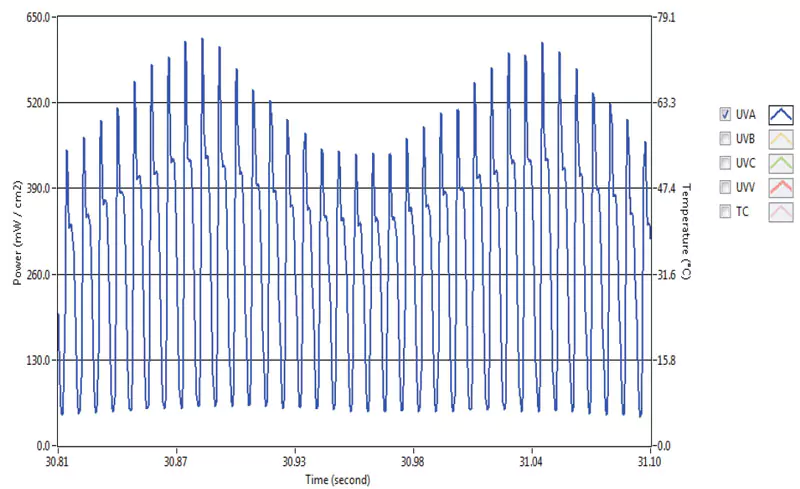
Zooming in on a 0.30-second portion of Figure 3 allows readers to see, in Figure 4, the lamp irradiance cycling based on the frequency (50 or 60 Hz) of the alternating current (AC).
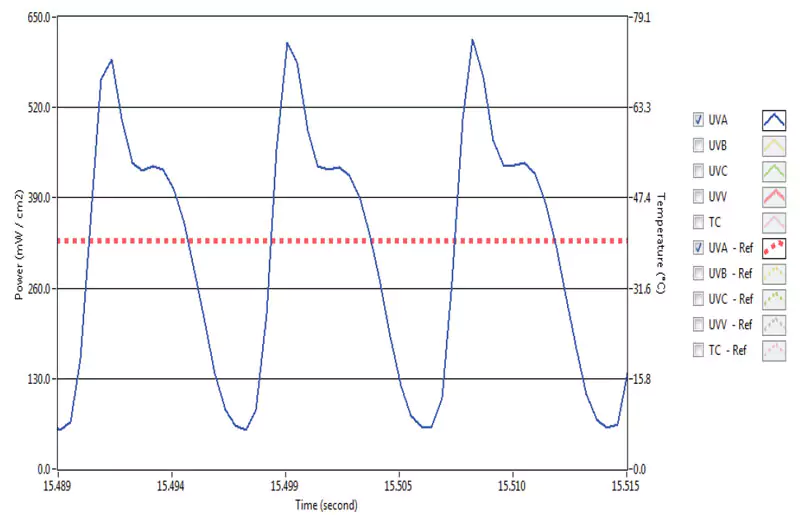
Figure 5 combines two irradiance profiles of another lamp at effective sample rates of 128 Hz and 2048 Hz.
- The time on the X axis is approximately 0.026 seconds.
- The blue irradiance profile with a peak of 618 mW/cm2 shows data collected at 2,048 Hz.
- The red irradiance profile with a peak of 329 mW/cm2 shows data collected at 128 Hz.
- Energy density values are the same.
- Both values are technically correct, based on the how the UV was sampled and is reported.
- Note: The shape of an irradiance profile collected on high frequency AC power supply and/or DC power supply (LEDs) at high sample rates can vary and, in some cases, show a slight ripple effect.
Proper sampling is important for elections and UV measurement. For UV measurement, remember:
- The fast user-adjustable effective (equivalent) sample rate found in many of today’s high-quality production radiometers allows users to collect more samples and obtain better samples than radiometers from only a generation ago.
- Take the time to understand your radiometer and its limits for data collection. Wide variations in irradiance values from one run to another may indicate an insufficient sampling rate.
- If the instrument has an adjustable sample rate, select a sample rate that is most appropriate for your application and collection speed.
- When comparing irradiance values, be sure to indicate how they were collected. It is important that everyone speaks the same language when it comes to measurement procedures. Clarify all values used in the supply chain and on formulator data sheets.
- Collect data in a manner that does not damage the process equipment or instrument, or injure the person trying to “catch” the instrument.
Parting thoughts
- Used properly, statistics are an invaluable tool. Applied improperly, statistics can show that anything is true or false.
- Statistics means never having to say you’re certain.
- 97.3% of all statistics are made up.
- 125% of Americans are tired of sampling and opinion polls.
![]() Jim Raymont
Jim Raymont
Director of Sales
EIT LLC
jraymont@eit.com