

By F. Timur Senguen, quality/DVT lead, and Chen Wang, materials scientist, Formlabs
In the context of additive manufacturing, the term anisotropy is typically used to describe the orientation-dependent physical properties of the printed part. This effect is commonly attributed to the layer-by-layer production method that yields a distinct macro structure in Fused Deposition Modeling (FDM) printing. As lines of molten polymer are deposited next to each other within a layer, the polymers become highly entangled. As a result, they merge tightly – resulting in stiff, tough and strong connections between deposited filaments within the layer. As layers of polymer lines then are deposited on top of the previously completed layers, the polymers are not able to entangle as completely, leading to less tight bonding between layers.
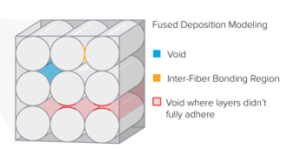
This difference in physical interfacing between layers and lines manifests in anisotropy: Forces that act on the weaker interactions between layers will have exaggerated effects over forces acting on the tighter interactions within the layers (Figure 1).
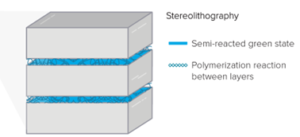
Due to the prevalence of FDM in the 3D printing world, anisotropy often has been generalized to affect all forms of 3D printing. This is unfortunate, since stereolithography (SLA) uses a fundamentally different approach to additive manufacturing. Rather than depositing polymers and allowing them to entangle, the resin monomers react and form covalent bonds, providing high degrees of lateral strength. The polymerization reaction is not driven to completion, thus arresting the layer in a semi-reacted state that allows subsequent layers to polymerize with it. This crosslinking on layers provides the same interactions between layers that are present within each individual layer, which results in a part that is much more uniform than FDM parts. Furthermore, in the subsequent post-curing step, where the parts are generously and uniformly irradiated, additional polymerization reactions take place uniformly throughout the parts. Therefore, in post-cured parts, the polymerization reactions are fully completed, and it is impossible to discern inter- and intra-layer cohesion along the axis of printing direction (Figure 2).
Due to the structural uniformity of SLA parts, one would not expect physical anisotropy to be as pronounced when compared to FDM-printed parts.
Anisotropy in engineering
Anisotropy in FDM is an important consideration for engineers as they design parts and orient them for 3D printing. Any part that is intended to withstand any amount of stress will need to be carefully oriented in such a way as to minimize the effect of anisotropy on its function, since mechanical properties such as maximum stress, elongation and Young’s modulus are all subject to anisotropy. Thermal properties – such as glass transition temperature, heat deflection temperature and thermal conductivity – are known to be affected by anisotropy as well.
Failing to account for anisotropy could lead to premature or catastrophic failure below the expected ranges. While this is only a moderate annoyance in prototyping a limited number of parts, as 3D printing gains more and more traction in massive customization applications and in digital factories, the problem becomes exponentially more important. As the applications of 3D printing continue to expand, minimizing or abolishing anisotropy becomes more and more desirable.
Since there is the potential for improved anisotropy in SLA parts, the production method can be used to mediate the complications associated with anisotropy. If SLA produces virtually isotropic parts, engineers and technicians could focus on other design and production aspects of parts, making SLA a much more attractive option over FDM.
Validating isotropy in SLA: materials and methods
To verify that SLA is, in fact, isotropic as its layer structure would imply, we chose the Formlabs Form 2 printer in combination with the company’s engineering and general purpose resin offerings: rigid, tough and clear. The resins were selected for their relevance in engineering. The resins were used to produce ASTM D638 Type IV tensile bars in various orientations relative to the XY plane to be tested for the commonly reported mechanical properties: maximum stress, elongation at break and Young’s modulus. These properties were chosen because they are derived from extremely destructive testing and will expose any physical weaknesses that may be caused by defects in the layer structure. If the mechanical properties are unaffected by orientation, these parts are, by definition, isotropic. It is highly likely that other physical properties are similarly isotropic.

The ASTM D638 Type IV tensile bars were printed in 15-degree intervals from 0 (flat relative to the XY plane) to 90 degrees (straight up and down). The support structures were automatically generated by the software. All the printing was conducted in 100-µm layer height with default print settings. After the printing, each set of bars was washed in isopropyl alcohol (IPA) with manufacturer-recommended durations and then post-cured with 405nm light with recommended temperatures and durations. (See details at the manufacturer’s website1). An example of the orientations of the tensile bars can be seen in Figure 3, with a set of samples with 15-degree increments with respect to the Z-axis as oriented in the software (left) and a picture of the tensile bars produced by the printer (right).
The tensile testing was conducted on an ADMET tensile tester equipped with a 500-lb load cell, and a clip-on axial extensometer with a gauge length of 1 inch. The tensile bars were strained at 0.2 inch per minute under 25°C. The Young’s modulus was determined by two-point linear fitting under 1% strain. For each sample, four or more bars were tested.
Results and discussion
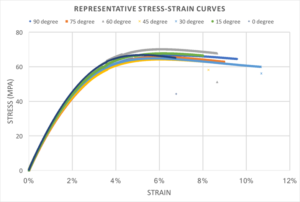
First, we tested the clear resin, which reportedly obtains 65 MPa of ultimate tensile strength, 6.2% elongation at break and 2.8 GPa of Young’s modulus. The tensile stress-strain curves are shown in Figure 4, where each curve represents a set of tensile bars printed at a particular angle with respect to the Z-axis. The curves, though, vary a bit with each other – especially with regard to the elongation at break, and overlap well with each other. All the curves show a classic stress-strain profile of glassy polymer materials. As the applied strain increases, all the samples show almost identical elastic deformation, yield, strain hardening, plastic deformation and, ultimately, fracture. It is worth noting that a recent study shows tensile properties in FDM-printed parts vary significantly when printed in 0 and 90 degrees.2 The well overlapped stress-strain curves in this SLA-printed sample validate the hypothesis that SLA parts are isotropic in mechanical properties as a result of the polymerization reaction between layers and the uniform post-curing reactions.
As shown in Figure 4, the elongation at break varies quite a bit. This is very common in glassy polymers, and the elongation is inherently with a very high degree of error. Therefore, in the subsequent study, we focus on two of the aspects in the tensile properties – ultimate strength and Young’s modulus – in our benchmarking of the anisotropic properties. Moreover, since in this study we focus on the variation between the samples printed at different directions, we chose the tensile properties of the 45-degree bars as the “standard” and examined the discrepancy of bars at other directions with respect to that standard.
Ultimate strength is the highest amount of sustained force that the bar can withstand before it fractures; this is usually what people mean when referring to a material as being “strong.”
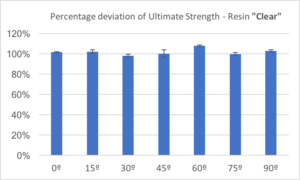
It is obvious how ultimate strength should be used as a measure of anisotropy: If a part is built with weak chemical bonds between layers, it would show significantly diminished strength when the tensile forces are exerted perpendicular to the XY plane. The percentage deviations of ultimate strength of the clear resin at various orientations with respect to the ones printed at 45 degrees toward Z-axis, are shown in Figure 5.
The ultimate strength measured for clear resin at 45 degrees was 65.6 MPa, with a standard deviation of 2.5 MPa. Even with the limited number of samples tested, the ultimate strength at 0, 15, 30, 60, 75 and 90 degrees matches very well to the one at 45 degrees. The percentage deviation varied from 98% to 107%, with standard deviations smaller than 5%. Those variations are small enough to conclude there is no discernable difference among the samples. Also, it is worth noting that no trend of variations exists with respect to the orientations of bars being printed. This clearly demonstrates the observable anisotropic properties in the clear resin.
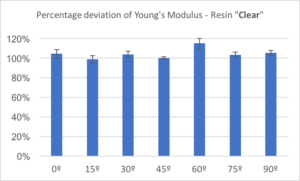
Young’s modulus is particularly important to engineers who make design decisions based on expected stiffness in a given application. Similar to ultimate strength, weaker bonds between layers are expected to cause decreases in Young’s modulus, making this another important metric for investigating isotropy in SLA-printed parts. The percentage deviation of Young’s modulus of the clear resin at various orientations with respect to the ones printed at 45 degrees toward the Z axis, are shown in Figure 6.
As expected, the Young’s modulus falls roughly along a horizontal line, again indicating that print orientation does not affect the material properties of SLA-printed parts. These data lend further support to the hypothesis that SLA-printed parts are isotropic.
Furthermore, we implemented such measurement to the two other resins in the experiment: tough and rigid. Tough is a material with a slightly lower ultimate strength than clear but with a much higher elongation at break. As a result, tough is considered as a non-brittle material and thus suitable for functional prototyping. Rigid is a composite material filled with silica, and thus obtains a very high Young’s modulus (~4 GPa) while not being brittle. We hypothesize that because the attributes of isotropy are fundamentally rooted from the SLA process, all SLA formulations are generally isotropic independent of resin formulations.
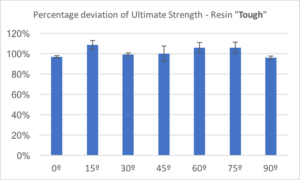
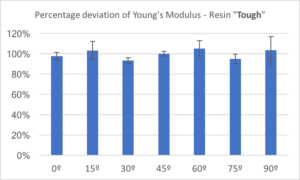
The percentage deviations of ultimate strength and Young’s modulus of the tough resin at various orientations with respect to the ones printed at 45 degrees toward the Z axis, are shown in Figures 7 and 8, respectively. The ultimate strength of the tough resin varies from 96% to 108%, with respect to the 45-degree samples, which are of a slightly higher variance than in the clear resin; however, they mostly are within the range of one standard deviation. The Young’s modulus of tough resin at various orientations also falls nicely in a horizontal line, indicating no significant variance among those samples.
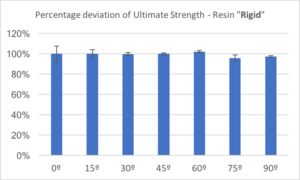
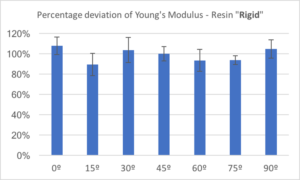
Figures 9 and 10, respectively, show the percentage deviations of ultimate strength and Young’s modulus of the rigid resin at various orientations with respect to the ones printed at 45 degrees toward Z-axis. Similarly to what we observed in clear and tough resins, the rigid resin showed isotropic behavior in both ultimate strength and Young’s modulus. Even though the rigid resin is heterogeneous in molecular structure, since it contains silica fillers, the polymerization reaction during printing and post-curing provides strong enough chemical bonds to obtain isotropic properties.
Conclusion
All of the collected evidence points to one conclusion: SLA 3D printers produce parts that are as strong and tough in the Z direction as they are in the X and Y directions, no matter how the parts are oriented in the build volume. Based on the tensile testing data, we can derive that the other properties that may be relevant to engineering are also unaffected by print orientation, including flexural strength/modulus, heat deflection temperatures, impact strength, hardness, thermal expansion, etc. This gives SLA-based 3D printing a significant advantage over FDM printers in the field of engineering, where reproducing those properties reliably is crucial to the function of produced parts.
References
- https://support.formlabs.com/hc/en-us/articles/115001414464-Form-Cure-Time-and-Temperature-Settings
- https://www.sculpteo.com/blog/2014/05/14/material-considerations-choose-right-plastic-production-method-part-2/
F. Timur Senguen (timur@formlabs.com) is quality/DVT lead and Chen Wang (chen@formlabs.com) is materials scientist, both at Formlabs. For more information, call 617.702.8476 or visit www.formlabs.com.


