


For UV measurement and process control, “an ounce of prevention is worth a pound of cure” even though I prefer to use properly measured and documented values that include Joules and Watts. The best technology can be held hostage to bad everyday practices.
This column compiles best practices implemented by EIT customers to improve their process monitoring and control. The IT team at EIT classifies my computer challenges as “PICNIC” errors: “Problem In Chair, Not In Computer.” For analyzing customer-collected UV data, I have repurposed our IT “PICNIC” acronym to: “Problem In Collection, Not In Calibration.”
The following suggestions should improve your UV measurement data collection and minimize your UV “PICNIC” errors. Implement as many of these best practices as you can.
1. Organize Your Recordkeeping
A messy desk can lead to the loss of valuable information – or at least a loss of time while searching for it. Create an Excel spreadsheet in company intranet or cloud-based folders to allow for easy entry, access, sharing and retrieval of data from anywhere. Back up the information on a regular basis either manually or through a service provider. Name your files so the right data can be located quickly, and missing data is easily apparent. Naming your file “UV Data 12_20_19 Line 4” is more descriptive than “UV Data Backup.”
Hanging a clipboard next to your UV line to enter key process parameters, including UV values, is simple and easy but lacks the data analysis tools available in a spreadsheet.
Whatever approach you take, have the data available. Relying only on your ink and coating suppliers to take and keep your important process data could leave you in a bind if they are not available.
2. Use Consistent Data Collection Techniques
For the most accurate and reliable results, it is important to pay attention to small details that can introduce unintended (and often unobserved) variations.
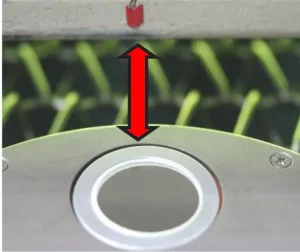
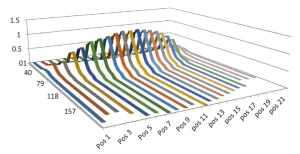
Place the instrument in the same location (with the optics in the same orientation) each time a measurement is made. A small index mark – using tape or a permanent marker – on the UV system allows the user to align the optics in the same location and orientation on the conveyor each time. On wide arc-based systems, take multiple readings across the width of the conveyor.
Measurements are best collected under comparable conditions, including internal instrument temperature. Instruments too hot to touch are too hot to take a reading.
Consistency in measurement means allowing your UV system to warm up and stabilize per the recommendations of the manufacturer. During warm-up, review and confirm a checklist of desired settings – such as power level, lamp height and conveyor speed – before taking a reading. Confirm (with appropriate UV eye/skin protection) that the instrument optics are maintained at a consistent height throughout the path of travel in the UV system. Consider the use of a fixture to stabilize the instrument movement. On lines with rollers, use a fixture to prevent the radiometer riding an up and down “surfing” motion between the rollers, which can lead to inconsistent Watt values.
3. Perform UV System Maintenance
For quality control, change is a persistent enemy. Some changes are due to natural aging of equipment and are expected as the production hours increase. Other changes, such as premature equipment failures and self-inflicted human error, can occur unpredictably and at any time.
Below is a checklist of common issues that require attention. It is not comprehensive, but a good starting point. Use it to brainstorm with your team to identify sources of change and/or failure on your system.
- Reflectors are contaminated, transmitting less energy, especially in the shortwave (UVC) region.
- Belt/conveyor tension has changed, causing slippage.
- Conveyor speed changed, causing variations in Joule readings.
- Incorrect bulb type (e.g. mercury vs. doped) installed.
- UV LEDs have burned out.
- Replacement lamps are improperly situated in the reflector.
- Light source location has changed.
- Bulb manufacturer has changed.
- Cooling supply air and or water has changed.
- Power supply settings have been altered by an operator.
- Shutters are sticky or failing.
- Quartz plates have become contaminated.
- Specialty (e.g., dichroic) reflectors have become contaminated.
- RF screens and gaskets have been damaged.
- Magnetrons are aging.
4. Establish and Document a Process to Collect, Record and Maintain UV System Data
Based on the needs and requirements of your UV process, decide the who, how, frequency, where, when and what data will be collected and recorded. Suggested “best practice” process information considerations include date and time; operator name; line conditions, such as conveyor speed; power supply levels; and frequency of measurement.
Each radiometer has its own specific optical response. Instruments from different suppliers may provide different values, even with the same UV source, data collection process and measurement position. Radiometer settings (see this column in Issue 3, 2019), such as the effective sample rate, also can affect how values are reported.
Suggested “best practice” radiometric information includes:
Recording the data and also specifying the radiometer manufacturer, model, UV band and, if applicable, the effective sample rate.
Reporting 616 mW/cm2 and 227.8 mJ/cm2 [EIT PowerMAP II, UVA (320-390 nm), 2048 Hz/Smooth Off ] is clear and conveys more information than only reporting 616 mW/cm2 and 227.8 mJ/cm2.
You may need different radiometers for different types of UV sources – both in output levels and the type of source. A radiometer optimized to measure the UV from a high-intensity curing source may not work on UV from a low-intensity source. A radiometer designed and calibrated for a mercury lamp may not provide accurate numbers when measuring a UV LED.
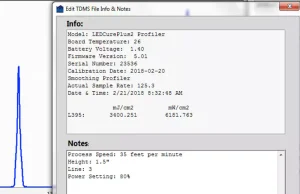
Recording detailed information provides a complete picture of the UV system performance that will make comparisons and problem-solving easier when trouble arises and these details are long forgotten. Radiometers that will allow you to save the data/irradiance profile to a computer also may allow you to add notes to be entered directly into the file so all process information is in one location and the process conditions stay with the file.
5. Maintain Your Instrument
Just as your UV line changes over time, so do your test instruments. UV radiometers often operate in harsh conditions, including intense energy (UV, visible, infrared), temperature and coatings, and are not always handled with tender loving care. Instruments can become coated, dropped or stuck in a system.
To rely on the radiometer’s data, the instrument has to be calibrated and well maintained. When your instrument requires service, send it to the manufacturer or use a manufacturer’s authorized service center that can conduct genuine repairs.
Between calibrations, follow the manufacturer’s instrument care and cleaning guidelines. Small mistakes – wiping the optical window with a contaminated shop rag or abrasive cotton swab – can damage the optics and prevent an accurate reading. You may even wish to purchase packets of optical wipes designed for cleaning your instrument to prevent accidental damage.
Parting Thoughts
In the words of the famous cartoon character Yogi Bear: “Be smarter than the av-er-age bear.” Avoid UV-related PICNIC errors by implementing the best practices that make sense for your organization. Start 2020 with solid data, and find time to enjoy a real “pic-a-nic” basket” …away from work.
 Jim Raymont
Director of Sales
EIT LLC
jraymont@eit.com
