


By Chris Davis, head of sales – Industrial Systems, IST America
Complex technical processes, used in the production of medical devices, require validation if the results cannot be measured immediately. Examples of such processes are:
- sterilization,
- aseptic packaging/assembly,
- injection molding and
- UV polymerization of adhesives and varnishes.
UV polymerization is widely accepted for its fast and reliable results as well as its relatively uncomplicated installation and operation. It also offers a strong cost/benefit ratio.
The rigorous guidelines of good manufacturing process (GMP) conformal production supervision control demand an evaluation of these technologies, and the supervisory authorities require detailed and documented validation. The scope of documentation varies depending on whether the final product is considered a Class 1, 2 or 3 product.
When there is uncertainty about the validation requirement or scope of the validation for the critical processes/plants, the Global Harmonization Task Force (GHTF) Guidelines “Process Validation” and the recommended decision scheme1 provide an outline to the desired validation.
A workable approach seems to be detailing the process, analyzing every part of it regarding an eventual risk and implementing it into the existing risk management system. Risk management should be understood as a continuous iterative process throughout the lifecycle of a product that requires regular, systematic updating. A methodic approach to risk management has been described by ISO EN 14971. For reference, tools for risk analysis include the following:
- Direct-/Indirect-Impact, as identified by the International Society for Pharmaceutical Engineering (ISPE)
- Failure Mode and Effects Analysis (FMEA)
- Ishikawa (Fishbone)-Diagram
- Hazard Analysis and Critical Control Point (HACCP)
When the curing process can be numerically modeled, an approach to failure effects can be determined using statistical values such as 6 Sigma, knowing the parameters of the process window.
This article is intended to define a numerical approach, to enable UV curing technology and to present a rigorous description for GMP validation delivering reproducible and repeatable results.
A quick side note on the guiding standards: ISO 13485 vs. FDA QSR 21 CFR 820; ISO 13485:2016 and FDA QSR 21 CFR 820 differ in several points, avoiding a harmonization in the past.
- ISO 13485:2016 is a standard based upon ISO 9001:2008 and is specific to the design and manufacture of medical devices. This standard was projected to be adopted by the Food and Drug Administration (FDA) in 2019. Originally intended to be implemented in April 2019, as this issue of UV+EB Technology went to press, this step was still pending due to necessary congressional action. (See https://www.iso.org/standard/59752.html.)
- Title 21 CFR 820 is the current quality system for medical devices used by the FDA.
Further observations in this article relate to ISO 13485 as the common international standard.
Finding the process window

Analytical determination of the degree of curing – FTIR spectroscopy
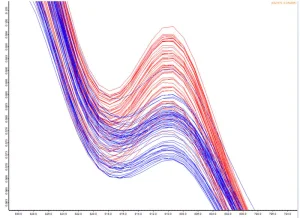
Fourier-transformed infrared spectroscopy (FTIR) is a spectroscopic technique that operates by receiving a continuous infrared spectrum of absorption or emission of a solid, liquid or gas. An FTIR spectrometer (with connected data storage) collects high spectral resolution data over the selected range, thereby capturing variations in specific wavenumbers as a derivate of the wavelength, which then quantifies the number of waves in a unit distance. At 810 cm-1 the interesting changes in acrylates can be observed and indicate whether the material is polymerized. Unfortunately, the use of FTIR for epoxies is limited, although it is possible to find indicators in other wavenumbers.
Using this method, the cross-linking, as a result of a given dose/intensity combination, can be precisely determined. Different layer thicknesses can be determined by adequate experiment set-up. The graphic contains the complete information for a given formulation from the wet state to fully achievable crosslinked state. The key information is the area under the curve as a direct proportion to unlinked acrylates. In other words, the less area under the curve, the more the sample is crosslinked. When this information is added to a speed/UV energy density diagram, a process window can be defined within necessary parameters.
The next step is to determine the necessary energy density/intensity combination so it is analytically defined and therefore predictable. This involves a statistical approach to determine a GMP-validated process window using Design of Experiments (DOE) and multivariable data analysis.
Design of Experiments
Introduction
For a company to continue to successfully evolve in existing markets, the manufacturing and production functions/processes are designed to allow ongoing innovation and, ultimately, optimization. Key areas are as follows:
- Production volume
- Production development time
- Cost cutting
To drive continuous development (and the accompanying change to production characteristics and subsequent process results), DOE is a tool with clear benefits. To make this as efficient as possible, statistical methods are used for experimental design.
Why statistics in the design of experiments?
When carrying out experiments to optimize production processes in industrial operations, the same measurements are not always obtained, despite careful work. Among other things, random differences (for example, the base materials) play a role in the measurement conditions, and the experimental results can be scattered.
In order to grasp these divergences, a central point must be defined: Statistics enable rational decision-making, despite random scatter of the measured values. Therefore, through statistics, test differences between process and production variants are recognized and can be quantitatively assessed.
Trials cost time and money. For the given experimental design, it must be ensured – in the interest of economic feasibility – that the number of trials is proportionate to the amount of time, resources and material available for the experiment to have a reasonable return.
Typical targets are (according to literature2) a project time reduction of 40% to 75% and a trial cost reduction of 40% to 75%.
Procedure for a DOE (Principle)
At the outset of the experiment planning, all participants (research and development, marketing, production) should agree on the investigation objective to avoid unsatisfactory results. Process results and product parameters should be translated into specific technical parameters. Of central importance is the mean value and the statistical deviation of the measurements. Process results/product parameters themselves are suitable target values.
The quantitative knowledge of the target values and the impact on the product’s quality allow the definition of a process window that guarantees the product’s desired characteristics. Within the parameters of this process window, the statistical deviations are included, so that even after worst-case deviations, the desired product parameters don’t suffer more than the allowable and predefined tolerances.
For a robust process and product, it is then valid that disturbance factors are minimized in the production process. The dispersion of the control variables (process parameters) should be kept as low as possible, as this reduces the duration and associated costs of the analysis.
An optimal trial design will then depend on the following parameters:
- Target sizes (see Figure 2)
- Number of factors (see Figure 2)
- Desired accuracy of the results
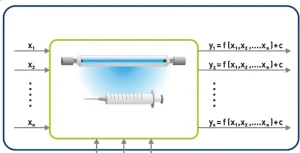
The more one wishes to determine the effect of the factors and the more the experimental results show deviation (the measure is the standard deviation σ), the more individual tests are required. For the factors and target sizes, the picture in Figure 2 emerges.
For a practical evaluation of the test results, integration of a software package is helpful not only for analysis but also to structure the results, as this can be problematic in the experimental design, due to the abundance of information.
The software (statistical analysis) can be used to determine the following parameters, among others:
- Numerical values for the size of the effects
- Width of the confidence intervals
- Statements about the significance of the effects
Once the results are technically understood, improvements to the process can be implemented.
Production development and DOE
As illustrated, a process from a known application development will be analyzed, and the evaluation and interpretation will be briefly presented:
Background and task
This particular project is to investigate UV curing of prosthetic limbs, irradiated by UV with a plastic layer. A good starting point value can be determined with the help of a test plan (DOE).
Evaluation of the experimental design and conclusions
To describe an experiment successfully, quantitative or qualitative values must be determined. For a simple exposure series, this might be speed, distance, lamp type, etc. The test objective can be quality tests, such as tensile strength, scratch resistance or other factors that are generally selected in pre-evaluation. Other variables can be added after starting the experiment, when the first correlations between different factors are calculated. The results of the resulting parameter sets can then be represented graphically.
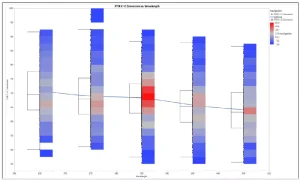
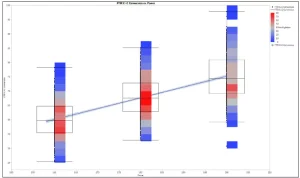
Figure 4 illustrates C = C % vs. energy. As desired, the percentage of cross-linking increases with higher energy. On the other hand, if the C = C conversion vs. wavelength is plotted (Figure 5), it can be seen that the conversion is around 385 nm (red tint), despite lower turnover. Therefore, 385 nm is most suitable for curing.
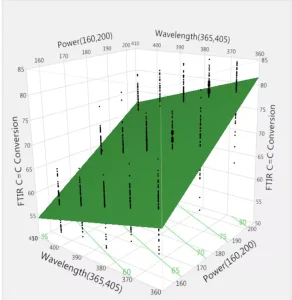
A three-dimensional representation of the three parameters (C = C conversion, wavelength, energy) is shown in Figure 6, confirming the expected result, and these are based on Figures 4 and 5. High energy and a wavelength of 385 nm lead to the desired high conversions.
Summary and perspective
With the increasing speed in development, production and time to market of innovative medical devices, determining quality standards is a typical dilemma of manufacturing. One challenge in individualized mass production is identifying commonalities and making targeted use of them to minimize differences and expense in product design.
An important factor is the complete documented development of the product along the entire value chain. This allows a digital image to be created that maps all information about the product and the processes from the physical to the digital world. This not only enables efficient process design and organization but allows measures for avoiding errors and increasing efficiency.
In order to build technical knowledge about data, however, the networking of all processes along the product life cycle is necessary. The development of a technological product description starts with the factors that have been assumed and then qualified for its development. The focus is on optimal planning, harmonizing and securing the product within the processes.
With DOE, an instrument is created that enables an agile process design. The results will provide the basis for documentation that conforms to DIN ISO 13485 (which stipulates the requirements for documentation in the process development). This method responds to the need for consistent documentation from the beginning and allows for later design adaptions. Desirability for the lowest deviations around a mean value can be found by analytical evaluation of the multivariable database and automated to exclude possible human factors. This allows for a consistent set-up for complex curing applications and will be an important factor in digitally describing production environments.
References
- GHTF/SG3/N99-10:2004 (Edition 2)
- W. Kleppmann, Experimental design – Optimizing products and processes, Carl Hanser Verlag, Munich – Vienna, 2016
Chris Davis is head of sales – Industrial Systems at IST America. A degreed mechanical engineer, Davis joined the industry in 1993 driving narrow- and mid-web press sales until 2015 when he joined IST. Areas of expertise include printing, converting and industrial radiation curing applications. For more information, visit www.ist-uv.com/en.


