In the last edition of Professor’s Corner, we began a discussion of the glass transition temperature (Tg).1 In this issue, we will continue that discussion by investigating three methods for experimental measurement of this all-important polymer property: 1) Dilatometry; 2) Differential Scanning Calorimetry (DSC); 3) Dynamic Mechanical Analysis (DMA). These three methods are based on three different polymer properties that change significantly and in a measurable way when the temperature approaches the Tg. These include changes in specific volume, changes in heat capacity and changes in the ability of the polymer to store or dissipate mechanical energy.
Free Volume Increase. Since the Tg of a polymer is the temperature at which the onset of long-range segmental motion occurs,2 perhaps the most obvious physical change it must undergo as the temperature nears the Tg is that its “free volume” must increase to provide room or space for the segments to actually move. Free volume is the space within a sample that is not occupied by any molecule or atom. It is literally “empty space.” The spaces seen among the spaghetti strands in the model shown in Figure 1 of the previous edition of Professor’s Corner represent the free volume.3 So, as we think about the occurrence of increased movement of the relatively large segments of polymer chains at the Tg, additional space for these movements is required. Therefore, any method that allows one to measure the increase in volume of a given polymer sample with increasing temperature can be useful in determining the Tg.
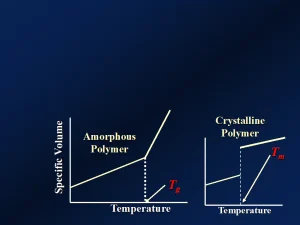
Dilatometry is a widely used method for measuring changes in specific volume, the reciprocal of the density, in polymers.4. As the density decreases with increasing temperature, the specific volume increases. It turns out that, for polymers, the specific volume increases in approximately linear fashion with temperature. At the Tg, a linear relationship continues, but at a distinctly different slope and higher rate of increase. These effects are depicted schematically in Figure 1. The inflection point in the curve in Figure 1 is indicative of the Tg. (Recall from the previous article that only the amorphous regions of the polymer will exhibit a Tg.)5
Thermal Energy Changes. Since the structure of a polymer changes as it passes through the Tg, many of the fundamental properties, in addition to specific volume, also change. These include thermal properties that can be measured by several common thermoanalytical methods, including DSC, DMA and others. A detailed discussion of these methods of analysis is beyond the scope of this column. However, a brief discussion of DSC and DMA is provided.
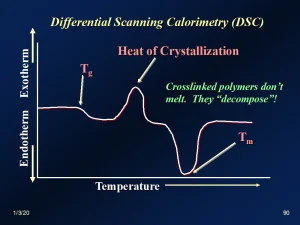
DSC is based on the principle that, as a material goes through various thermodynamic phase transitions, both “primary” and “secondary,” thermal energy is either absorbed (endothermic) or emitted (exothermic). Since the Tg involves a structural change at the molecular level, the sample is expected to have a measurable change in enthalpy (∆H) during that transition. DSC methodology measures such changes for relatively small samples (~0.5 to 10 mg).6 Stevens gives a good summary of DSC instrumentation.7 While raising the temperature of the sample and a reference at a constant rate, the instrument records the thermal changes occurring. These changes are then recorded as a DSC “thermogram.” Figure 2 is a schematic representation of a thermogram. As the temperature is increasing, the absorption or emission of thermal energy is recorded. In Figure 2, a downward change in the curve represents an endothermic change, the first of which is an indication of the Tg for the sample. The second endothermic change indicates the crystalline melting temperature (Tm). Note that the Tm endotherm is much larger than the Tg. A third transition – exothermic in this case – is depicted between the other two. This is known as the heat of crystallization (∆Hcryst). Some polymers, once having passed through their Tg, will experience a realignment of chains, resulting in an increase in microcrystallinity. The resulting attractive forces among the chains will produce an exothermic change in enthalpy. UV/EB-polymerized materials typically will not exhibit a ∆Hcryst.
DMA is a very sensitive, though more expensive, method for determining the Tg of polymers. The technique involves sinusoidally straining and relaxing a sample at a given frequency as the temperature is raised. Viscoelastic materials, such as polymers, are those that have both “solid-like” and “liquid-like” properties. During a DMA scan, the solid-like properties of the sample are recorded as the “storage modulus” – the ability of the sample to store mechanical energy during testing. Conversely, the liquid-like properties of the polymer are recorded as the “loss modulus” – the ability of the sample to dissipate mechanical energy through molecular frictional interactions.
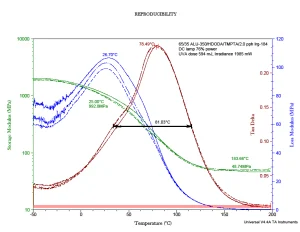
Figure 3 provides a representative DMA thermogram for a UV-polymerized material. The DMA properties were measured using three samples to test reproducibility. The green curves represent the storage modulus change with temperature, while the blue curves represent the loss modulus change. The red curves (known as “tan δ”) are calculated from the ratio of the loss and storage moduli rather than by direct measurement. The maximum in the tan δ is generally taken to represent the Tg! It is the temperature at which the liquid-like properties are at a maximum relative to the solid-like properties. (Note that the loss modulus scale is linear and relatively small while the storage modulus scale is logarithmic.) When comparing Figure 2 with Figure 3, it is obvious that DMA provides a much more sensitive measurement of the Tg.
As the temperature increases during a DMA scan, the UV-polymerized and crosslinked sample represented in Figure 3 expands. With this expansion, the sample loses the ability to store energy, and the green curve descends. As the sample expands, at the molecular level, the “net” formed by the crosslinks eventually reaches its maximum extension. To expand farther would break covalent chemical bonds, and decomposition would occur. So, the storage modulus reaches a minimum and then becomes independent of temperature. This region of the thermogram is known as the “rubbery plateau.” The storage modulus value in the rubbery plateau is a function of the crosslink density of the polymer.
What about the loss modulus? As the sample begins to expand, its ability to dissipate energy through frictional interactions increases since there are more energetic collisions occurring. But then those frictional forces reach a maximum, after which they decline rapidly as the polymer chains move farther apart. In the case of a crosslinked polymer, when the network has reached the maximum allowable extension, the frictional energy loss drops to near zero.
DMA is an awesome thermoanalytical method that can provide a wealth of information about the structure and nature of polymers. Figure 3 provides one more piece of information relevant to these Tg discussions. Note that the half-height peak width has been highlighted. This measurement is related to the relative heterogeneity of the polymer film at the molecular level.8
The tan δ curve can be thought of as representing a mixture of different Tgs for different domains within the polymer sample. Were the polymer perfectly homogeneous, this curve would be a “spike,” and the entire sample would have a single Tg. What produces this heterogeneity? Ah! That is a topic for a future article. Stay tuned to the Professor’s Corner!
References:
- Christmas, B. K., “Professor’s Corner,” UV+EB Technology, 6, No. 1, 1st Quarter, 2020, pp. 16,17.
- ibid., p. 16
- ibid.
- van der Beek, Maurice H.E. Specific Volume of Polymers: Influence of the Thermomechanical History, Technical University of Eindhoven, Eindhoven, The Netherlands, 2005, p. 2. https://doi.org/10.6100/IR590887
- op. cit., Christmas, pg. 16
- Stevens, Malcolm P., Polymer Chemistry: An Introduction, 3rd Edition, Oxford University Press, 1999, p. 150
- ibid., pp. 150-152.
- Morales, Timothy; Rueda, Elda; and Christmas, Byron. “The Relative Effects of AC- and DC- Powered UV Lamp Systems on the Properties of UV-Polymerized Films,” Proceedings, UV&EB Technical Conference, RadTech International, North America, Chicago, 2008.
 Byron K. Christmas, Ph.D.
Professor of Chemistry, Emeritus
University of Houston-Downtown
b4christmas@gmail.com