


In the 2023 Q2 edition of UV+EB Technology, an overview was provided of UV-/EB-based binders for Lithium-ion battery (LiB) applications as being a promising chemistry that first appeared as a demonstrated “Environmentally Green Technology.” 1 The author’s company has been developing UV- and EB-curable binders to replace polyvinyldifluoride (PvDF) and the hazardous solvent N-Methyl-2-Pyrrolidone (NMP) in Li-ion Cathode manufacturing processes. The high peak irradiance of Miltec 650wpi UV HPI system drives throughcure of the final UV binder cathode on the aluminum cathode carrier.
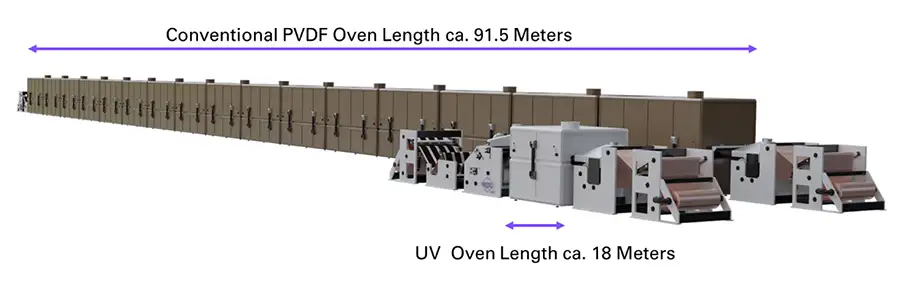
UV cathode binder technologies have been proposed to reduce the environmental impact, improve manufacturing speed and significantly lower the cost of battery-cell manufacturing while offering competitive battery performance and cycle life. Going to a UV-curable binder system would result in substantial savings by replacing N-Methyl-2-Pyrrolidone (NMP) with a lower boiling point and more environmentally friendly solvent to allow for faster line speeds and reduced footprint of equipment required. This is represented by the footprint reduction (Figure 1) upon going from an oven-based PVdF binder to a UV binder for the manufacture of Li-ion cathodes. Other benefits include safety enhancement and environmental risk during recycling of polyfluoroalkyl substances (PFAS).
There are several types of non-UV binders used in lithium-ion batteries that have been classified as Polysaccharide-type, Inorganic and Alkane-based. These binder systems have been summarized by Quin and al. and classified by primary properties such as adhesion, tensile strength, elasticity, swelling behavior, ionic conductivity, thermal stability and oxidative stability. PVDF has been found to have improved overall properties than other binder systems, such as polytetrafluroethane, gelatin, polyacrylic acid (PAA), polyethyleneglycol (PEG) and styrene butadiene (SBR). Until recently, few technical publications have cited the use of UV/EB acrylate backbone materials for designing LiB binder systems. 1-3
In this Part 1 of 2, the construction and components of the lithium-ion battery will be reviewed, with emphasis on the overall performance of the battery as defined as “Cycle Life,” including storage capacity, capacity retention during cycling and electrochemical impedance spectroscopy (EIS). Binder properties needed to meet these performance requirements include 1) high-adhesive properties to bind the chemical active material (CAM), conductive material and collector together during charge and discharge cycling, and 2) percent electrolyte uptake for Li-ion uptake/release during charge/discharge cycling.
Part 2 of this series will focus on what effect the polymer backbone and pendant groups of the UV binder have on physical properties, such as mechanical and thermal properties, as these relate to “Cycle Life” of the LiB battery.
Fundamentals of a LiB: Current PVdF binder in Li-ion batteries

A Li-ion battery is a device used to store energy by moving Li-ions between two electrodes. These electrodes, termed anode and cathode, can store lithium ions. Energy is stored and released as lithium ions travel between these electrodes through the electrolyte, as depicted in Figure 2. 4 In addition to the anode and cathode, a third component called a separator is placed between the electrodes. The separator electrically insulates the anode from the cathode but contains pores to provide a pathway for Li-ions to travel back and forth between the electrodes during charging and discharging of the cell.
What is a cathode?
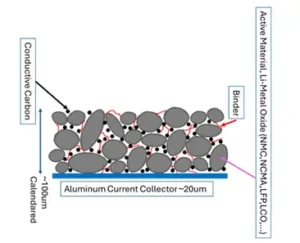
The cathode active material is a source of Li-ions that migrate through the electrolyte to the anode during charging and migrate back to the cathode during discharge. The cathode is constructed from a current collector that is a thin metal foil of electrically conducting material, typically aluminum 26 ums, and is coated with a mix of cathode active material, binder and a conductive additive. The active cathode solid particles are held to the cathode aluminum current collector and to each other by a polymer binding material that functions to retain adhesion and dimensional stability during charging and discharging cycles.
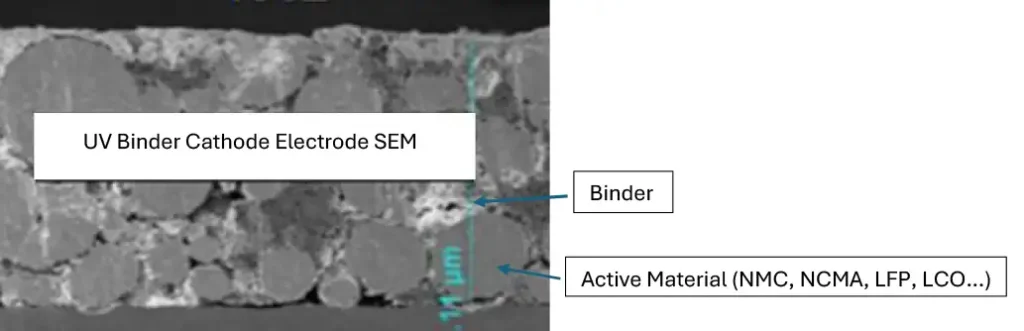
The construction of the cathode electrode is illustrated schematically in Figure 3, showing the active component joined to each other by the binder strands with the conductive material embedded in the matrix. The SEM photos of a UV cathode material show the active material particles of NMC 811 covered by UV binder materials with conductive carbon embedded into the matrix (Figure 4). 5
Cathode active materials are the powerhouse of the LiB being prepared that include particles of metal oxides, such as lithium, cobalt, manganese, nickel or vanadium oxides, and other lithium compounds, such as lithium iron phosphate, as summarized in Table 1. The most common combination is that of lithium cobalt oxide (cathode) and graphite (anode), which is used in commercial portable-electronic devices. Table 1 also lists the Specific Capacity (mAh/g) of each active material to gage high mass loadings for specific applications. Nickel, manganese and cobalt as the principal components in mole ratios of 8:1:1, (NMC 811) display the highest specific capacity of ca 230 mAh/g that has been used in the author’s company’s current studies. The D50 particle size for NMC 811 in lithium-ion batteries has been reported to be ca 10 microns, with a range between 8 and 13 microns. In general, smaller particle size D50 NMC811 results in higher charge/discharge specific capacity values.
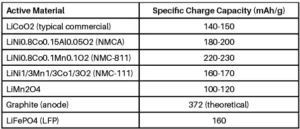
Table 1 lists common cathode materials used in lithium-ion batteries, including LiCoO2, NMC variants (LiNixMnyCozO2) and LiMn2O4, where the highest specific capacities are for NMC 811 at 230 mAh/g and NMCA at 180-200 mAh/g and lowest LiMn2O4 at 100-120 mAh/g using a graphite anode with a high specific capacity of 372 mAh/g. Although lower in energy density than NMC, LFP is another very commonly used CAM in batteries that serves the electrical vehicle market and is an integral part of these studies.
What does specific capacity mAh/g vs. cycle performance reveal about LiB performance?
LiB cell performance typically is evaluated by using 1) charge/discharge graph of voltage vs. specific capacity, 2) capacity retention curves of % capacity retention vs. cycles and 3) specific capacity vs. cycles. Hence, any changes in the chemical structure of the polymerized UV cathode binder can be observed by these test methods.
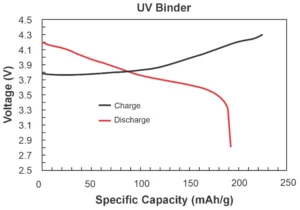
When interpreting a charge/discharge graph of voltage vs. specific capacity mAh/g of coin cells prepared from either PVDF or UV binders, coin cells are subjected to cyclic charge and discharge at a rate of C/10 (10 hrs), with a voltage window of 3.0 to 4.3 V. During charging, the specific capacity of the active material increases to the theoretical value of ca 230 mAh/g at 4.3 volts in the case of NMC811. During discharge, the specific capacity curve shows a steep decline in voltage with a steep decrease to ca 195-200 mAh/g. For example, the UV-curable binder in Figure 5 exhibits excellent performance and characteristic voltage curves for NMC811 active material with a ratio of 94:3:3 Active; Binder; Conductive. These results compare well with current coin cells made from PVdF binder.
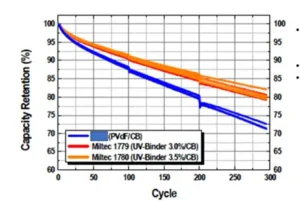
Another way of evaluating the effect of UV binder on performance is to use a Capacity Retention graph of LiB capacity retention (%) vs cycle that plots the percentage of a lithium-ion battery’s original capacity (capacity retention) against the number of charge-discharge cycles it has undergone. This shows the battery’s ability to store charge decreases over time as it repeatedly is cycled through charging and discharging. A higher capacity retention percentage at a higher cycle count indicates a longer battery lifespan of the battery, as illustrated in Figure 6, for the conventional PVDF binder vs. one of the author’s company’s prepared UV binders at the same loadings. The UV binder shows improved capacity retention at C/10 vs. PVDF at comparable loadings for the specific UV binder formulation. The two UV binders from the author’s company exhibit higher capacity retention over 300 cycles @ 80% fade vs. the currently used PVDF 200 cycles at 80% fade (blue).
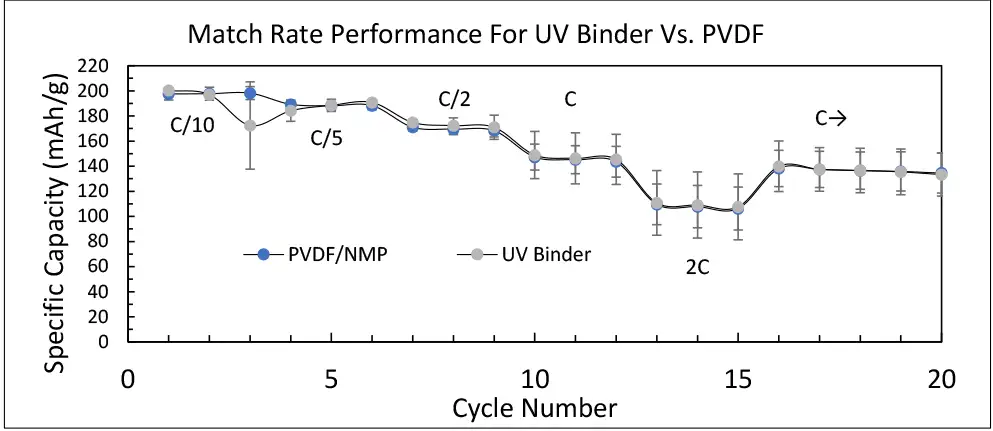
When interpreting a graph of “specific capacity (mAh/g) vs. cycles” for lithium-ion batteries, a higher specific capacity value indicates a greater energy storage per gram of battery material, while the cycle number represents how many times the battery has been fully charged and discharged. A steeper decline in specific capacity with increasing cycles signifies faster capacity degradation over time, highlighting a trade-off between high initial capacity and long cycle life. 3 The rate of charge/discharge is represented by the C value of C/10 (10 hrs), C/5 (5 hrs) or C/2 (2 hrs), and C (1 hr). Typically, the charge rate begins at a very low value of 10 hrs and increases to 5 hrs, 2 hrs, 1 hr and returns to 2 hrs, all for three cycles to show that decomposition does not take place by the final specific capacity value. This is represented in Figure 6 below for the control PVDF/NMP cathode and the UV binder/PA systems prepared into coin cells.
Figure 7 shows that rate performance of each cell matches, indicating good battery performance. Mass loading, calendared density and material ratios were kept the same to accurately compare the samples. High performance is critical to the adoption of UV-curable binder in the battery industry. Any new UV-curable binders must meet or exceed current PVDF performance to be considered for production.
What is electrical impedance in Lithium-Ion batteries?
Electrochemical impedance spectroscopy (EIS) is a method used to analyze the internal resistance of a lithium-ion battery (LiB), and a higher internal resistance, as measured by EIS, directly impacts the battery’s rate performance. EIS is used to determine the influence of the binder on electron movement and Li-ion particle connectivity within the LiB electrode structure. The output of data is used to construct a Nyquist plot.
A Nyquist plot is comprised of semicircles at different frequency ranges, which represent different electrochemical processes within the battery. The size of the semicircle indicates the resistance associated with that process, where a larger semicircle signifies higher resistance, usually related to factors like electrode degradation or poor electrolyte conductivity. The low-frequency region shows a sloping line, indicating diffusion limitations in the electrolyte, while the high-frequency intercept on the real axis represents the bulk electrolyte resistance. By analyzing the shape and size of the semicircles, one can assess the health and performance of the LiB, identifying issues like aging, surface-film formation or poor electrode-electrolyte contact. 7
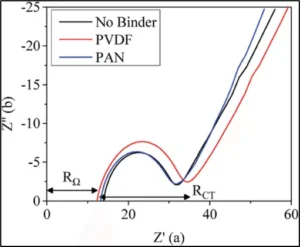
A Nyquist plot for PVDF NMC811 is illustrated in Figure 8, where the x axis represents the ohmic resistance (RΩ) and y axis represents the negative imaginary component resistance. Features of the Nyquist plot are ohmic resistance (RΩ) of the cell, including the electrolyte resistance and contact resistances within the cell, a semi-circular curve in the high-frequency region representing the charge transfer resistance (Rct) at the electrode-electrolyte interface, followed by a sloping line in the low-frequency region indicative of lithium-ion diffusion within the electrode material. The overall shape of the semicircle indicates a larger impedance due to the added resistance of the PVDF binder compared to polyacrylonitrile (PAN). The exact appearance of the semicircle will depend on factors like the binder loading, particle size distribution of NMC 811 and electrolyte composition. 7,8 The EIS profiles of PAN vs. PVDF show slightly higher-charge transfer resistance RCT ohmic resistance of PVDF vs. PAN. The slopes after the semicircles representing ion diffusion are very similar.
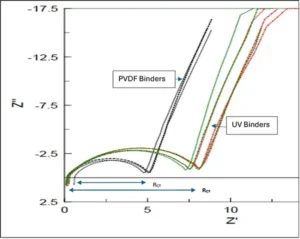
The EIS plots for PVDF and UV binder-based cells are illustrated in Figure 9 prior to rate testing. The diameter of the semicircles is the charge transfer resistance, which translates to cell polarization when it starts to cycle. The cell with the UV binder exhibited higher charge-transfer resistance RCT (7.5 ohms) as compared to the PVDF cell, (5 ohms). This may be due to differences in binder absorption on the surface of the particles. The upward-sloped line following the semicircle is ion diffusion. In this comparison, both UV binder and PVDF are all similar as there does not seem to be any diffusion limitation of the lithium ions. 9
Effect of electrolyte soaking of UV binder cathode on adhesive strength
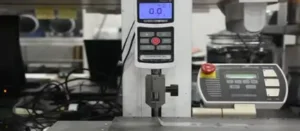
The UV binder used in a cathode electrode must exhibit good adhesive strength to hold both the active and conductive materials together, as well as to the collector during charge and discharge cycling, as illustrated in Figures 4 and 5. To mimic the harsh environment of the binder in electrolyte, an electrolyte soak test was used to determine the level of adhesive failure over time as determined by a 90-degree peel test of the cathode electrode (Figure 10). The percentage uptake of electrolyte (swelling) was determined by this simple formula: % Uptake (Swelling) = Weight gained by the electrode/Initial weight of electrode * 100. UV binder/cathode systems that passed this test would be further evaluated by preparing coin cells for electrochemical performance.
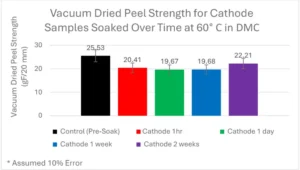
UV binder cathodes were prepared on an aluminum collector and subjected to electrolyte soaking over time to determine what effect soaking had on peel strength of the cathode materials. The highest peel strength was observed for “presoak” prior to testing at 25.53 gF/20 mm that decreased to 20.41 gF/20 mm after one hour. Very little change was observed in peel strength test data from 1 hr time to 2 weeks. The 1 hr peel strength value was 20.41 gF/20 mm, which did not change significantly at 2 weeks, 22.21 gf/20 mm. Although this data does not tell us how the cathode peel strength changes in electrolytes during charge and discharge cycles, it is an indication that the UV binder is not showing catastrophic failure between interfaces in a short period of time (Figure 11).
Effect of electrolyte soaking on uptake capacity of UV binder cathodes
LiB must exhibit uptake capacity of electrolyte during Li-ion charge/discharge cycling. This allows for continuous movement of Li-ions between anode and cathode within the battery cell. Otherwise, specific charge capacity would be low and affect the overall performance of the battery.
Dimethoxycarbonate (DMC) uptake for cathode electrodes was investigated for several cathode materials by measuring the uptake of the electrolyte after soaking for a period at
60° C, removing the excess electrolyte off the surface and re-weigh to get the delta weight gain.
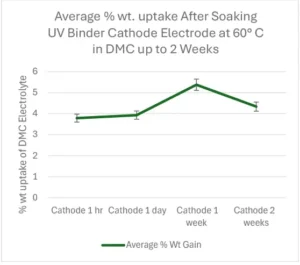
A graph of percent uptake of DMC electrolyte at 60° C for a UV cathode electrode over time is illustrated in Figure 12. The % uptake starts at 3.8% and increases to 4.3% after two weeks, indicating very little change over time. In contrast, PVDF binder has been reported to have between 11% to 19% electrolyte uptake after a 48 hr soak that is dependent on degree of crystallinity. The higher % uptake for the PVDF binder cathode electrode can result in improved battery performance or reduced mechanical stability and lead to swelling issues. The latter will result in adhesive failure and lower specific capacity of the LiB.
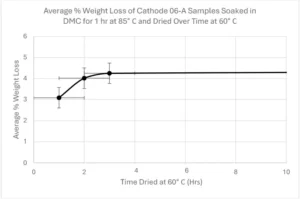
Similarly, the average % wt loss of the cathode electrode soaked in DMC at 85° C for 1 hr and dried over time at 60° C indicates a 4.25% wt. loss that remains constant after 3 hrs (Figure 13). This value is very close to the % uptake of electrolyte and further indicates that there is very little change in volume of the skeletal structure of the UV binder/cathode that would be beneficial during charge and discharge cycling.
In Part 2 of this article, the effects of UV binder backbone structure on mechanical (DMA analysis, storage and loss modulus, and Tan Delta Tg), thermal (DSC) and electrical properties, including capacity rate data vs. cycles, will be discussed.
References
- Sigel, D. Bauman, O. Hamann, P. Abbott, D. Hensley, A New Class of UV-Curable Binders for Battery Applications, UV+ EB Technology, Q2, 2023.p20.
- Du, S. Schissel, Electrons In, Electrons Out: Electron Beam for Battery Production, UV + EB Technology, Q3, 2022.
- Qin, Q. Li, X. Yu, and H. Li, Design of functional binders for high-specific-energy lithium-ion batteries: from molecular structure to electrode properties Ind. Chem.Mater. 2024, 2, 191-225.
- Schematic diagram of charge and discharge of Li Ion Battery, Research Gate
- SEM Images of cathode prepared using NMC811, UV binder, conductive carbon taken from Miltec Internal Document
- Table of common active materials used in Li Ion Battery, Research Gate
- Gabersek, Understanding Li-based battery materials via electrochemical impedance spectroscopy, volume 12, Article number: 6513 (2021)
- Explanation of Nyquist plot of PVDF and NMC 811, Research Gate
- Nyquist plots/data analysis performed by Dr. Chariclea Scordilis-Kelly, Sion Power Corporation.
 Gary A. Sigel, Ph.D.
Senior Principal Scientist, Lab Manager
Miltec UV
gsigel@miltec.com


