


By Dr. Calvin Lakhan, Circular Innovation Hub, Faculty of Environmental and Urban Change, York University
Few descriptors in packaging carry as much implicit reassurance as “water-based.” The term evokes benign chemistry, low emissions and an easy sustainability win. Energy-cured systems, by contrast, often are perceived as industrial and energy-hungry, associated in the popular imagination with specialized lamps and high-voltage equipment. Perceptions of this kind shape procurement decisions, marketing claims and, in some jurisdictions, regulatory posture. They rarely are tested against measured data.
This article summarizes a comparative life cycle assessment (LCA) conducted at York University’s Circular Innovation Hub that set out to do exactly that. The study modeled the cradle-to-gate environmental performance of three ink and varnish systems – water-based, ultraviolet (UV) cured and electron beam (EB) cured – across nine common packaging formats, ranging from film-foil laminates and shrink sleeves to wine labels and printed beverage cans. Three impact categories were evaluated for the printing process: carbon footprint, volatile organic compound (VOC) emissions and energy consumption.
The results run counter to the intuitive ranking. Across every format modeled, EB inks showed the lowest carbon footprint, the lowest VOC emissions and the lowest energy consumption of the three systems. UV inks occupied a consistent middle position. Water-based inks, despite their reputation, ranked last on all three metrics within the boundaries of this study. The differences are substantial in relative terms – EB printing generated roughly 40% less carbon than water-based printing in every scenario – even though the printing layer itself represents a small share of any package’s total footprint. Both halves of that sentence matter, and this article gives them equal weight.
How the Study was Built
Nine packaging scenarios were selected to span the breadth of applications where converters routinely choose among ink chemistries: a film-foil laminate, shrink sleeves using PVC and PETG films, wrap-around labels on OPP and PET films, a flexible dog food bag, paper and synthetic wine labels, and a printed aluminum beverage can. Each scenario was decomposed into its constituent layers – films, foils, adhesives, coatings, release liners and inks – with the weight and percentage composition of every component recorded from product specifications. Each configuration then was modeled three times, once with each ink system, holding all other layers constant.
Life cycle inventory data were drawn from the ecoinvent database (version 3.8), with modeling and impact assessment performed in SimaPro 9.3. Climate impacts were characterized using the IPCC 2013 GWP 100a method, expressed as kilograms of CO2-equivalent per tonne of finished product. Manufacturing energy was modeled against the North American electricity grid mix at an emission intensity of 120 g CO2e per kWh. Where recycled content appeared in a scenario, the cut-off method was applied in accordance with ISO 14044, assigning recycling burdens to the product containing recycled material without crediting avoided virgin production. A sensitivity analysis varied ink type, energy consumption and recycled content within reasonable ranges to test the robustness of the results, and a data quality assessment reviewed temporal, geographical and technological correlation in line with ISO 14044.
The differences among the three systems trace back to a small set of process-level parameters. The modeled emission factors were 1.5 kg CO2e per kilogram for water-based ink, 1.3 for UV and 0.9 for EB. At full coverage, VOC emissions were modeled at 10 grams per square meter for water-based systems, compared with 2 grams for UV and 0.5 grams for EB. Curing and drying energy followed the same ordering: 1.8 MJ per square meter for water-based drying, 1.2 for UV curing and 0.5 for EB curing. These parameters reflect the underlying chemistry and physics of each system. Water-based inks cure through evaporation, which demands sustained thermal energy and often involves co-solvents that carry VOC burdens. UV systems cure photochemically with moderate lamp energy and photoinitiators. EB systems cure through direct electron exposure, requiring neither photoinitiators nor a drying stage.
The VOC gap among the three systems directly follows from what leaves the film during curing. Water-based inks release co-solvents – typically alcohols, glycols and amine stabilizers – as the film dries, which account for the modeled 10 grams per square meter. UV and EB formulations essentially are 100% solids, with reactive monomers and oligomers converting into the cured film rather than evaporating, so their residual emissions reflect unreacted low-molecular-weight components rather than a solvent load. The further advantage of EB over UV, 0.5 vs. 2 grams per square meter, is attributable to the higher degree of conversion achieved by direct electron exposure, which leaves less unreacted volatile material in the cured film, and to the absence of photoinitiators and their fragmentation products. 1,2
What the Modeling Shows
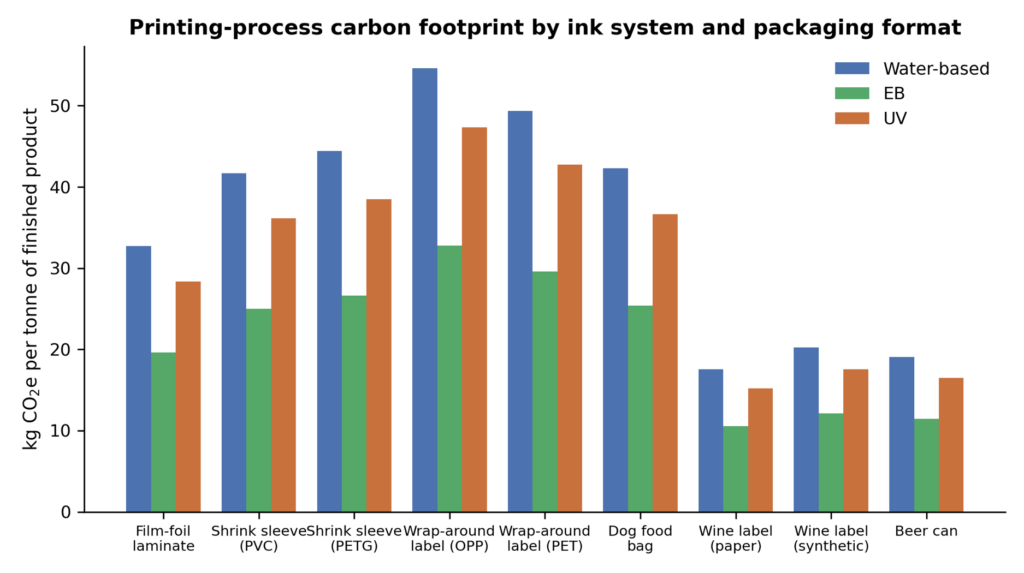
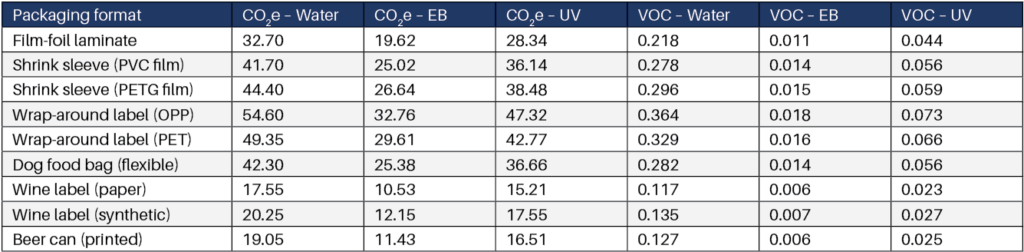
Figure 1 presents the carbon footprint of the printing process for each of the 27 format-ink combinations, and Table 1 reports the corresponding values alongside VOC emissions. Absolute values vary with the ink loading of each format – wrap-around labels (where ink represents up to 3.6% of product weight) sit at the high end, while lightly printed formats (such as wine labels and beer cans) sit at the low end. The relative ordering never changes. In every scenario, moving from water-based to EB ink reduced printing-process carbon emissions by 40%, and moving to UV ink reduced them by approximately 13%.
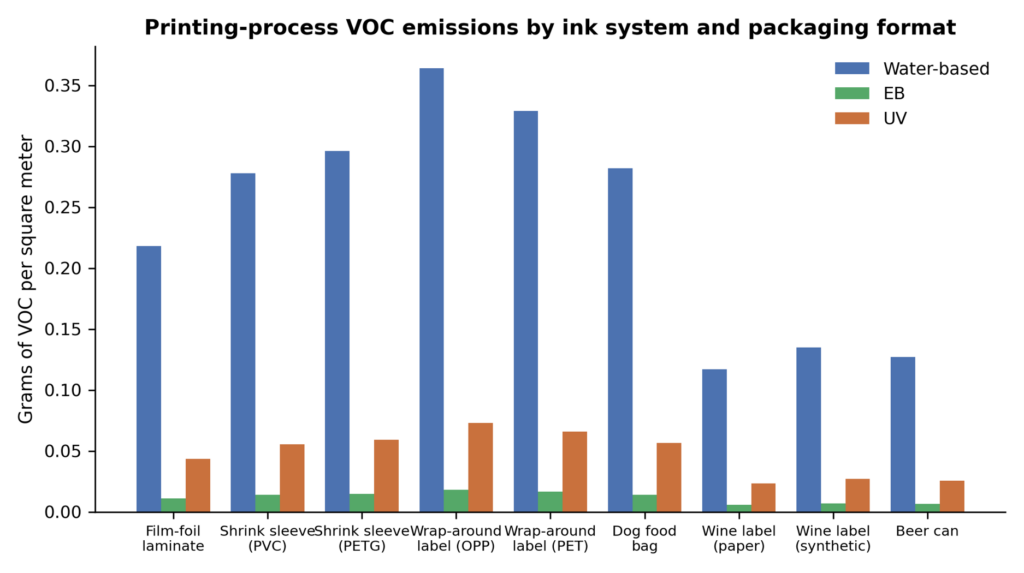
The VOC results, shown in Figure 2, are the most decisive of the three impact categories. EB printing reduced VOC emissions by roughly 95% relative to water-based printing in every format, and UV printing reduced them by roughly 80%. For a converter operating under air quality permitting constraints, or a brand owner facing tightening VOC regulation, this is the metric where ink chemistry does the heaviest lifting. The common perception that water-based systems are the low-VOC option holds only in comparison with traditional solvent-based inks; against energy-cured alternatives, the modeled results support the opposite conclusion, largely because of the co-solvents that many water-based formulations require.
Energy consumption followed the same pattern. EB printing consumed roughly 72% less energy per square meter than water-based printing across the modeled formats, and UV printing roughly 33% less. The findings often are counterintuitive to non-specialists, who associate energy-cured systems with power-hungry equipment. The modeling indicates that the sustained thermal load of evaporative drying exceeds the electrical demand of either curing technology on a per-unit basis.
The gap between the two energy-cured systems merits its own explanation. UV lamps convert electricity to photons with substantial losses to heat and non-actinic wavelengths, and the modeled UV figure also carries the production burden of photoinitiators, which are energy-intensive specialty chemicals. EB curing deposits accelerated electrons directly into the coating, transferring energy to the reactive chemistry with far smaller conversion losses and no photoinitiator requirement. These differences explain why the modeled EB energy input, 0.5 MJ per square meter at full coverage, sits at less than half of the corresponding UV value of 1.2 MJ. 1, 2
Keeping the Printing Layer in Perspective
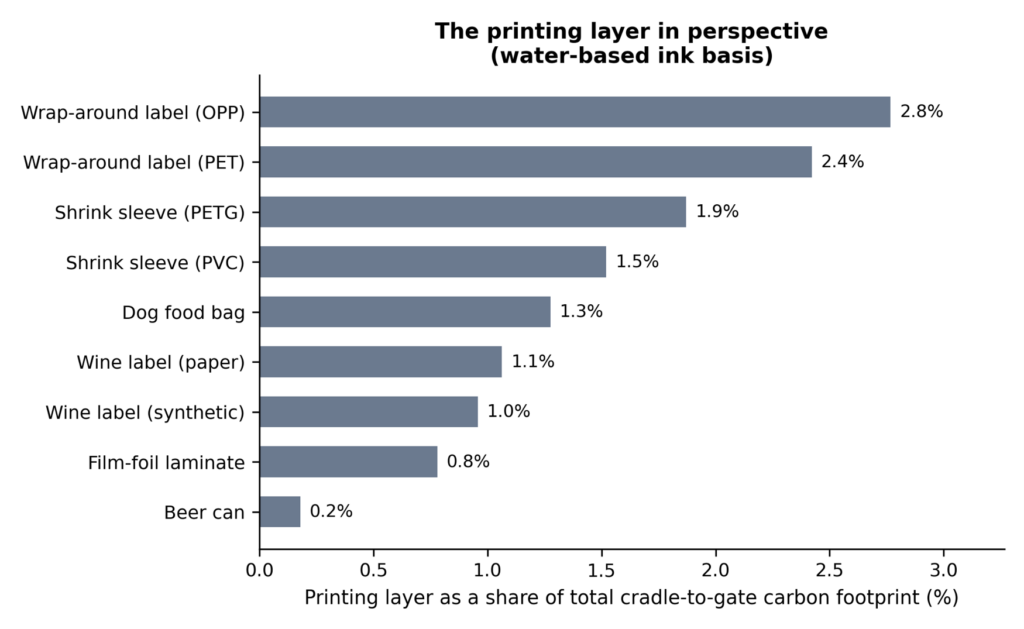
Honest environmental communication requires stating not only how large a saving is in relative terms but how much it matters in absolute ones. Figure 3 places the printing layer in the context of each package’s full cradle-to-gate carbon footprint. Depending on the format, printing accounts for between roughly 0.2% and 2.8% of total production-phase emissions. A printed beverage can is overwhelmingly an aluminum story – the can body contributes more than 10 tonnes of CO2e per tonne of product against 19 kilograms for the water-based printing layer. A film-foil laminate is dominated by its aluminum foil layer, and label formats by their face films, adhesives and liners.
The implication cuts in two directions. Switching ink chemistry will not transform a package’s carbon footprint, and any claim suggesting otherwise would misattribute the effect of a small component to the whole system. Substrate selection, lightweighting and recycled content remain the levers that move package-level totals. At the same time, ink selection is one of the few decisions a converter can change without re-engineering the package, requalifying the structure or renegotiating the supply chain. A 40% reduction in a small layer, achievable at the press rather than the package architecture, is a legitimate and low-friction gain – provided it is described as what it is. Where ink choice punches well above its weight is VOC performance, with direct consequences for air permitting, workplace exposure and community air quality that package-level carbon accounting does not capture.
Practical Considerations
The modeled results do not translate into a single universal recommendation, and the study does not support one. EB curing carries the highest capital cost of the three systems, and its economics favor high-volume operations that can amortize specialized equipment. UV systems occupy an accessible middle ground, with widely available equipment and moderate costs, at the price of requiring photoinitiators. Water-based systems retain the lowest equipment costs and remain well suited to absorbent substrates, such as paper.
Application-specific factors also matter. EB curing generates little heat, which suits heat-sensitive films, and it requires no photoinitiators, a characteristic relevant to food and pharmaceutical packaging where migration is scrutinized. UV systems offer strong durability and scratch resistance across varied substrates. Water-based systems can be appropriate where drying infrastructure already exists, and VOC exposure is well controlled. The environmental case assembled here is one input into a decision that also involves cost, substrate compatibility, food contact requirements and line speed.
Limitations
The study’s boundaries should be read alongside its findings. The analysis covers the production phase only; distribution, use and end-of-life stages fall outside the system boundary, so effects such as deinking behavior or recyclability interactions are not modeled. Emission coefficients drawn from ecoinvent represent averaged conditions and may not perfectly match any specific manufacturing line, and the study assumes average production efficiencies. Transportation of raw materials is included on the basis of average distances. These limitations are conventional for a comparative cradle-to-gate assessment, and the sensitivity analysis supports the stability of the relative rankings, but readers should treat the absolute values as modeled estimates rather than measured plant data.
Measure, Do Not Assume
The broader lesson of this assessment extends past ink chemistry. Environmental intuitions attached to material descriptors – “water-based,” “natural,” “plastic-free” – are unreliable guides to measured performance, and packaging decisions made on the strength of a label rather than an assessment risk optimizing for perception instead of impact. Within the boundaries of this study, energy-cured systems outperformed water-based systems on every metric evaluated, with EB consistently strongest. The finding does not crown a universal winner; it demonstrates that the ranking many practitioners would have predicted is inverted once the full production burden, including drying energy and co-solvent emissions, is counted. Sustainable packaging decisions deserve that level of scrutiny for every layer of the package, however small.
References
- Schwalm, R. (2006). UV coatings: Basics, recent developments and new applications. Elsevier.
- Drobny, J. G. (2010). Radiation technology for polymers (2nd ed.). CRC Press.
Resources
- Intergovernmental Panel on Climate Change. (2013). Climate change 2013: The physical science basis. Contribution of Working Group I to the Fifth Assessment Report of the IPCC. Cambridge University Press.
- International Organization for Standardization. (2006). ISO 14040:2006 – Environmental management – Life cycle assessment – Principles and framework. ISO.
- International Organization for Standardization. (2006). ISO 14044:2006 – Environmental management – Life cycle assessment – Requirements and guidelines. ISO.
- Lakhan, C. (2024). Comparative life cycle assessment of packaging inks: Evaluating the environmental impact of water-based, EB, and UV inks in sustainable packaging solutions. Circular Innovation Hub, York University. Full report available from the author on request.
- PRé Sustainability. (2022). SimaPro 9.3 [Computer software]. PRé Sustainability B.V.
- Wernet, G., Bauer, C., Steubing, B., Reinhard, J., Moreno-Ruiz, E., & Weidema, B. (2016). The ecoinvent database version 3 (part I): Overview and methodology. The International Journal of Life Cycle Assessment, 21(9), 1218–1230.

Dr. Calvin Lakhan is the founder and director of the Circular Innovation Hub in the Faculty of Environmental and Urban Change at York University in Toronto, Canada. His research examines the economics and environmental performance of circular economy systems, including extended producer responsibility, life cycle assessment of packaging and consumer recycling behavior. He has published extensively on materials policy and waste management for academic, industry and government audiences, and serves as an expert advisor on packaging and recycling policy in Canada and the United States. For more information, email lakhanc@yorku.ca or visit https://www.yorku.ca/euc/research/circular-innovation-hubdev/.