


Sy Syms, from Syms Clothing, ran commercials from 1974 through 2011 with the slogan: “An educated consumer is our best customer.” This column uses Sy’s approach to educate consumers to turn them into better customers. Understanding the source type, photoinitiator package and desired end properties in the cured product will guide measurement strategy and instrument selection. This column is about bands: not the musical type, but “bands” as they relate to UV measurement and process control.
Broad band source
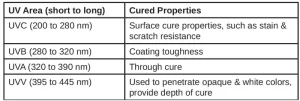
Mercury-based sources emit energy over a “broad” band (UV, Visible, IR) of the electromagnetic spectrum. The UV portion is normally broken down into four areas (UVA, UVB, UVC and UVV), as shown in Table 1. The numerical values for each area may vary slightly among authors, but the way each UV area influences the product properties is well established.

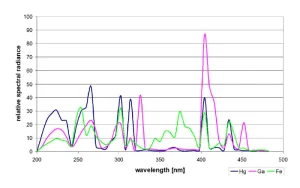
Additives to the mercury, such as iron (Fe) or gallium (Ga), can change the spectral output of the broad band source, as shown in Figure 1, to achieve or enhance desired cure properties. It is a common practice to use multiple sources, such as a mercury-gallium additive lamp, for through cure followed by a mercury lamp for robust surface properties.
Narrow band source
UV LEDs are narrow band sources with their peak spectral emission specified by their center wavelength (CWL). The CWL is narrow (1 to 2 nm), with manufacturers typically specifying it falling within a +/- 5 nm window. A 395 nm LED is expected to have its narrow peak output at 390 to 400 nm.
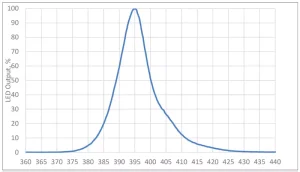
Commercial arrays have hundreds – even thousands – of individual diodes. Based on how the LED manufacturer selects (or “bins”) the diodes, the spectral distribution at the 50% power level (Full Width at Half Max, or FWHM) may be 15 to 20 nm wide. The distribution of energy from an LED at lower power levels (10%) may be 40 nm or more. (See Figure 2.)
In designing their instruments, radiometer manufacturers determine the responsivity, or the bandpass width and shape, of their devices. Two approaches they follow include:
- Wide Band (Instrument) Response. I classify an instrument with optic response of greater than 100 nm as a wide band instrument.
- Narrow Band (Instrument) Response. Narrow band instruments have an optic response of less than 100 nm wide, with some manufacturer bands as narrow as 10 nm.
Each approach has advantages and disadvantages. Both approaches have been used for years with broad band sources and, more recently, with LEDs.
Broad band mercury lamps have repeatable peak emission lines in defined spectral areas, i.e. the 365 nm line.
The peak output of an LED will vary based on the source type (i.e. 365, 385, 395, etc.) and the CWL (+/- 5 nm) in that source. Obtaining accurate, repeatable LED measurements from different LED sources, each with its own CWL variations, requires a radiometer with a flat response. Fabricating a flat optic response over a narrow band is easier than trying to fabricate a flat response over a wide band. There is less variation in the overall flatness of a narrow band than over a wide band.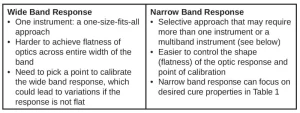
A narrow band approach allows some instruments to incorporate all optical components in the stated instrument response and not just the optical filter.
Multi-band instruments
Multi-band (UVA, UVB, UVC, UVV) instruments for broad band sources have been commercially available for over 30 years. They are popular for production lines with multiple mercury and mercury-additive sources. Measuring the irradiance and energy density values with a multi-band instrument allows the educated customer to:
- identify lamp types by examining lamp output across different bands,
- ensure that the correct lamp is in the correct position and
- monitor reflector cleanliness by looking at the UVA:UVC ratio. (UVC values will drop compared to UVA values in a system with a dirty reflector.)
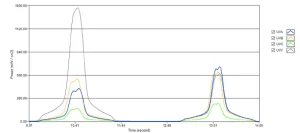
Figure 3 shows the output of two lamps collected with a profiling radiometer. Based on the ratio of the UV bands, the first lamp is mercury-gallium (high UVV output) and the second lamp is mercury. The example below clearly and easily shows the differences between source types.
Similar information can be obtained from the display of a multi-band radiometer. Individual lamps need to be measured one at a time and the irradiance values compared to one another. This approach is more work compared to using a one-pass profiling radiometer, especially with multiple lamps.
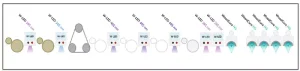
Customers utilizing LEDs also have started to optimize production lines using multiple and/or a mixture of different wavelength LEDs to achieve the desired product characteristics. Figure 4 shows the design of a wood coating production line developed by Efsen UV & EB Technology with multiple types of LED sources followed by mercury sources.
Multi-band radiometers optimized for different LED emissions now are commercially available. The response in each of the narrow bands is flat within the LED band. Each band is calibrated to the appropriate LED source type. A multi-band LED radiometer will allow you to identify the different types of LEDs, which cannot be done with a wide band radiometer.
Summary
Don’t forget the words of Sy Syms. Educate yourself and decide if a wide, narrow or multi-band radiometer best meets your needs. There are advantages and disadvantages with each.
Parting thought: This quarter’s column focused on “bands.” Being a rock star is not always glamorous. In some respects, it matches the day-to-day glamour of being a UV process control star.
 Jim Raymont
Director of Sales
EIT LLC
jraymont@eit.com
![]()


