

By Shuhua Jin, Erik Kareliussen and Chih-Min Cheng, Henkel Corporation
This paper will be presented at RadTech 2020 in Orlando, Florida, March 9-11.
For a full programming schedule, visit https://radtech2020.com/.
Abstract
The choice of photoinitiator (PI) is an important factor in the polymerization characteristics of light cure materials. This study investigated the influence of PI type and concentration on the surface tackiness and depth of cure (DOC) of experimental light cure acrylate formulations with several UV/visible photoinitiators. The chosen UV/visible photoinitiators include Type I PI phosphine oxide derivatives and Type II PI thioxanthone derivatives. Surface tackiness and DOC were also studied using two different radiation intensities emitted by LED 405 nm curing lights. A Design of Experiment (DOE) using Response Surface Methodology (RSM) was used to optimize thioxanthone and amine synergist concentrations for the most desired surface curing and DOC. The correlations of PI type and concentration with DOC help light cure material formulation to achieve a tack-free surface and suitable depth of cure, which are important in many adhesive applications.
Introduction
UV-curable adhesives are single-part products that can be cured rapidly and on demand when exposed to UV light to form a high-strength material. Different UV adhesive products have been designed that cure with different wavelengths and at different cure speeds. Cured adhesive properties include adhesion to substrates, surface tackiness and depth of cure, as well as mechanical properties such as hardness and tensile strength, tensile elongation and modulus. Several factors affect light curing adhesive performances, including the material’s composition, the choice of photoinitiators, the concentration of the initiators, the temperature, the peak wavelengths and bandwidth of the curing light, and the intensity of the light and the irradiation time.1-3
Depth of cure (DOC) is an important property to consider when evaluating adhesive curing performances and a guideline to applications. Some literature exists regarding the parameters affecting DOC of dental composites, but very little has been published regarding adhesive performance. Parameters affecting DOC include:
Light intensity (DOC in general increases with increasing intensity of the curing light).
Type of light. UV light with wavelengths below 365 nm will cure the surface extremely quickly, vitrifying the surface, blocking the UV light and preventing the material below from curing. UV to visible light, with wavelengths at 385 nm or higher, cures the material more uniformly and allows the UV to penetrate and cure adhesives in thicker sections. The closer the wavelength to visible range, the easier it is to cure through larger gaps.
Material opacity and color: Increasing opacity and color will decrease DOC.
Type of PI: Generally, there are two types of PIs. Norrish Type I PI produces free radicals by PI cleavage. Type II PI generates free radicals, with PI abstracting hydrogen from a co-initiator (amine synergist).4-5 PI should be chosen based on the UV lamp, with a spectral output that peaks in the optimal range for the adhesive cure.
Concentration of PI: It is PI dependent. It has been observed that, as the PI concentration is increased, the cure depth initially increases but then starts to decrease after reaching an optimal PI concentration.
Surface tackiness caused by atmospheric oxygen is also important for light cure acrylate adhesives. All the parameters affecting the DOC will influence surface tackiness of the cured adhesive.
In this study, different visible photoinitiators (those that absorb at wavelengths >400 nm) were studied to understand the effect of PI type and concentration on the surface tackiness and DOC. Many methods – such as hardness tests, interaction with color dyes, translucency changes, double-bond conversion, NM tactile tests, penetration tests and scraping tests – have been used to measure the DOC. In this paper, DOC was measured using a scraping method adapted from ISO 4049.6 There are many surface tackiness tests. One easy, qualitative method is to dust silicon carbide or talcum powder on the cured surface and then remove the powder by gentle rubbing or brushing.7
Materials
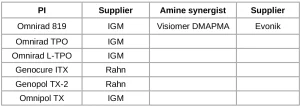
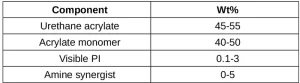
Table 1 is the list of the visible photoinitiators and amine synergists used in this study. Table 2 is a general formula containing different visible PI with or without amine synergists for this study.
Sample preparation and testing methods
Photoinitiator UV/visible absorbance spectrum: UV/visible spectrum of the PIs in Table 1 was acquired using ARM-1061 UV/Visible Spectrophotometric with each PI at three different concentrations 0.01, 0.1 and 1 wt% in acetonitrile.
DOC test: Each sample, based on the formulation in Table 2, was put into a plastic cylinder with 13 mm height and 6 mm diameter. The surface was flattened using a spatula, and the sample was cured using LED 405 nm flood lamps. The sample was removed from cylinder. The bottom soft part was removed. The DOC is the height of the cured solid.
Surface tackiness test: Each sample in Table 2 was applied on a glass slide to form a thin layer and then cured using LED 405 nm flood lamps. Silicon carbide particles were applied on the cured resin surface and brushed lightly to remove the powder. It is considered tacky if the black particles remain and tack-free if no visible black particles remain.
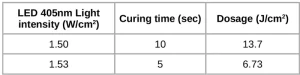
LED 405 nm light intensity and dosage: Samples were measured by LED visible UVV radiometer (Item # 1265282, Henkel ID: 5995, S/N UVV0059). Table 3 is the summary of LED 405 nm flood light intensity and dosage with two curing times. These are the curing conditions used for all the testing unless specified otherwise.
Results and discussion
UV/visible analysis of various visible photoinitiators
Three Type I phosphine oxide-based visible PIs, Omnirad 819, TPO and L-TPO; one monomeric Type II PI, thioxanthone Genocure ITX; and two polymeric Type II PIs, thioxanthone derivatives, Genopol TX-2 and Omnipol TX; were studied.
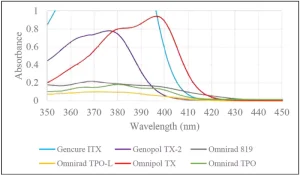
Figure 1 shows the PI absorbance spectra at wavelength 350 to 450 nm with 0.01 wt% of PI in acetonitrile solution. These PIs all have absorbance at visible range 400 to 410 nm.
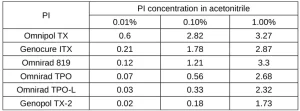
The absorbance values at 405 nm of each PI at concentration of 0.01, 0.1 and 1 wt% are listed in Table 4. The absorbance increases with concentration, but not linearly, as Beer’s law is not valid at higher concentrations.8 Among the six visible PIs tested, the absorbance of these PIs at 405 nm at 0.01% level has the order of: Omnipol TX > Genocure ITX > Omnirad 819 > Omnirad TPO > Omnirad TPO-L > Genopol TX-2. The trend is similar with other concentrations, but to a different extent. The absorbance at UV range 370 to 380 nm is bigger than the absorbance in the visible range.
The PI absorbance is directly related to its reactivity at the wavelength light is emitted and impacts the DOC and surface tackiness tested in this study.
DOC and surface tackiness study
DOC and surface tackiness of the formulas containing different PIs
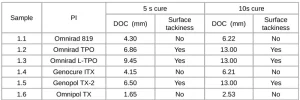
Three Type I phosphine oxide-based visible PIs, Omnirad 819, TPO and L-TPO; one monomeric Type II PI, thioxanthone Genocure ITX (ITX); and three polymeric Type II PI thioxanthone derivatives were studied, using the same curing condition. The PI loading for this testing was 1%. For Type II PIs, 2% of amine synergist Visiomer DMAPMA (DMAPMA) was added. The samples 1.1 to 1.5 were cured using LED 405 nm. Table 5 is the summary of the DOC and surface tackiness testing results of the formulas containing different PIs with 5s and 10s curing time, respectively. Figure 2 is a graph showing the correlation of DOC and PI type.
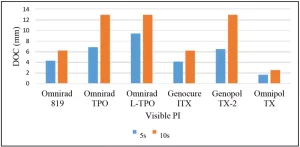
Results in Table 5 and Figure 2 showed that DOC is dependent on the PI used and curing time. DOC increases with curing time for all the PIs. For the three Type I Omnirad 819, TPO and L-TPO, it is demonstrated that the absorbance value or reactivity at 405 nm is in the order of 819 > TPO > L-TPO. For the three Type II PIs, ITX, TX-2 and TX, the absorbance or the reactivity at 405 nm is in the order of Omnipol TX > Genocure ITX > Genopol TX-2. However, DOC increases with decreasing reactivity at 405 nm. The results are consistent with both 5s and 10s curing. In this situation, lower PI reactivity favors DOC.
On the contrary, surface tackiness tests of the formulations with different PIs showed good correlation of free surface tackiness with PI reactivity. The data showed a tack-free surface of the formulas with high reactivity PIs – Omnirad 819, Genocure ITX and Omnipol TX. Other PIs with lower reactivity – Omnirad TPO, L-TPO and Genopol TX-2 – showed surface tackiness after both 5s and 10s curing, although DOC is relatively higher.
DOC and surface tackiness of formulas containing PI with different concentrations
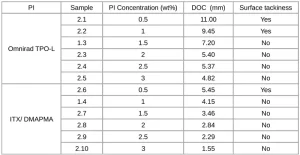
In this study, different concentrations from 0.5% to 3% of Type I phosphine oxide-based visible PI Omnirad TPO-L and monomeric Type II PI thioxanthone Genocure ITX (ITX) were studied using the same resin compositions. For ITX , the amine synergist used is DMAPMA and ITX/DMAPMA, weight ratio 1:2. The previous samples 1.3 and 1.4 with 1% PI, and new samples 2.1-2.10 with other concentrations were cured using LED 405 nm for 5s.
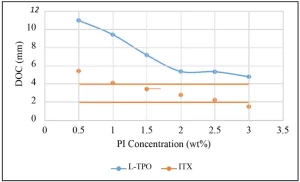
Table 6 is the summary of the DOC and surface tackiness of the formulas containing different concentrations of PI L-TPO and PI ITX, amine DMAPMA, respectively. Figure 3 is a graph showing the correlation of DOC and PI concentration. Results in Table 6 and Figure 3 show that DOC decreases with increasing PI concentration for both PIs. The trend is opposite for surface tackiness tests. High PI concentration is beneficial to tack-free surface. Comparing formulations with the same loading of TPO-L and ITX, DOC is lower with ITX, but the formulation with ITX results in a better tack-free surface.
Cure time effect on DOC and surface tackiness
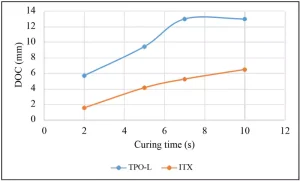
In this study, two formulas – Sample 1.3 with 1% L-TPO and Sample 1.4 with 1% ITX and 2% DMAPMA – were cured with LED 405 nm for different periods of time. Table 7 is the summary of the DOC and surface tackiness of the two formulas with different curing times. Figure 4 is a graph showing the correlation of DOC and length of cure time.
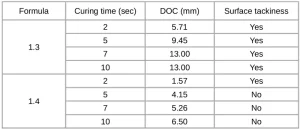
Results in Table 7 and Figure 4 show that DOC increases with increasing cure time for both PIs. The DOC of Sample 1.3 showed DOC reached full depth of 13 mm after 7s. The surface still showed tackiness after 10s curing, due to the selected PI concentration. Increasing curing time in this case didn’t improve surface cure.
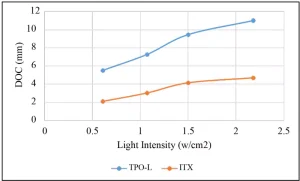
Curing light intensity effect on DOC and surface tackiness
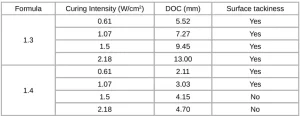
The two formulas, Sample 1.3 and 1.4, were cured with LED 405 nm under different intensity for 5s. Table 8 is the summary of the DOC of the two formulas with different curing intensity. Figure 5 is a graph showing the correlation of DOC and curing light intensity. Results in Table 8 and Figure 5 show that DOC increases with increasing curing light intensity for both PIs. The surface of Sample 1.3 still showed tackiness, even with increased light intensity, due to the selected PI concentration. For Sample 1.4, surface turned from tacky to non-tacky after curing intensity increased.
DOE study on formulations with ITX loading and DMAPMA/ITX ratio
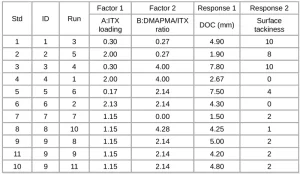
In this study, the DOC and surface tackiness performance are optimized by design of experiment using rotatable central composite design (CCD), which is one of the designs in response surface methodology design. There are two factors used in RSM study.9,10 Factor 1 is monomeric PI ITX loading, ranging from 0.17% to 2.13%. Factor 2 is the ratio of amine synergist (DMAPMA) to PI (ITX) loading, ranging from 0 to 4.0. The RSM design comprises 4 factor points, 4 axial points and 3 replicates of central points with a total of 11 runs. Adhesives are cured with 405 nm LED light for 5s. Response DOC is measured in the above-mentioned technique. Response surface tackiness was quantified by the relative amount of SiC powder remaining on the cured adhesive surface after brushing. If no SiC powder sticks to the surface, it is rated as “0,” and if all the powder remains on the surface, it is rated as “10.” Any values in between 0 and 10 were estimated based on the amount of SiC powder remaining. The RSM design points and response data are summarized in Table 9.
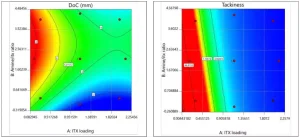
The results were analyzed by using Design Expert Version 11 software. Statistical analyses (regression and ANOVA analysis) of each response were carried out to determine the goodness of fit of each model and to estimate the coefficients of the polynomial equation. For response DOC, a reduced quadratic model was obtained with R2adj and R2pred of 0.905 and 0.789, respectively. For response surface tackiness, transformation with inverse square root was applied to have a linear model with R2adj and R2pred of 0.863 and 0.785, respectively. The final model equations are listed in Equation 1 for DOC and Equation 2 for surface tackiness. Their corresponding surface contour plots are shown in Figure 6.
Equation 1:
DOC = 5.917 – 5.166 * ITX loading + 2.173 * amine/ITX ratio +
1.337 * (ITX loading)2 – 0.380 * (DMAPMA/ITX ratio)2
Equation 2:
1/ Sqrt (tackiness-0.5) = 0.066 + 0.536* ITX loading + 0.038 * DMAPMA/ITX ratio
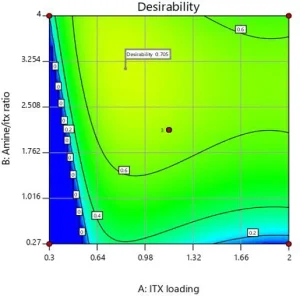
By applying multiple response optimization for maximum DOC and minimum surface tackiness, a high desirability of 0.7 is obtained to have predicted DOC of 5.6 mm and surface tackiness of 3.4. The optimized formulation is composed of 0.84% of ITX and DMAPMA/ITX loading ratio of 3.14. The optimization desirability plot is shown in Figure 7.
Conclusions
This work examined the effect of visible photoinitiator type and concentration, as well as LED 405 nm intensity and curing time on the depth of cure and surface tackiness of an acrylate resin system under LED 405 nm light curing. UV/visible absorption spectra of the visible photoinitiators were used to obtain the PI absorbance at 405 nm. The 405 nm absorbance of the six PIs tested at 0.01% concentration has the order of: Omnipol TX > Genocure ITX > Omnirad 819 > Omnirad TPO > Omnirad TPO-L > Genopol TX-2. The PI absorbance correlates to its photocuring reactivity. The study proved, as literature reported, that DOC decreases with increasing reactivity at 405 nm; however, less surface tackiness was observed with increasing PI reactivity. With increasing PI concentration, the curing speed increased, resulting in less oxygen inhibition and less surface tackiness. The DOC decreased with increasing PI concentration due to the light blocking from the polymer gel formed on the resin surface. DOC increases with increasing curing intensity and time, as expected. Surface curing will be improved with curing time, although the tests in the study didn’t show any differences.
It is important to understand how these parameters work together in order to optimize the surface curing and depth of cure of the selected resin systems, and DOE is a good tool for this optimization process. DOE using RSM allowed us to optimize Type II PI ITX concentration and amine synergist DMAPMA/ITX ratio for the most desired surface curing and DOC. A high desirability of 0.7 is obtained to have predicted DOC of 5.6 mm and surface tackiness of 3.4 with optimized formulation comprising 0.84% of ITX and DMAPMA/ITX of 3.14.
References
- P. L. Fan, R. Schumacher, K. Azzolin, R. Geary, F. Eichmiller, “Curing Light Intensity and Depth of Cure of Resin- Based Composites Tested According to International Standards,” Journal of the American Dental Association, Volume: 133, Issue: No. 4
- J.H. Lee et al., “Cure depth in photopolymerization: Experiments and theory,” J. Mater. Res., Vol. 16, No. 12, Dec 2001, p3536-3544
- Alonso et al. “Photoinitiator concentration and modulated photoactivation: influence on polymerization characteristics of experimental composites,” Applied Adhesion Science 2014, 2:10, p1-8
- Lambson technical bulletin “An Overview of Free Radical Photoinitiators”
- Lambson technical bulletin “Photoinitiators for LED curing”
- ISO 4049 (2009). International Standard, Dentistry- Polymer-based restorative materials, 4th Edition, Switzerland.
- Mark W. Pressley, “Dual cure adhesive formulations,” US 2012/0145312 A1
- David Harvey, “Spectroscopy Based on Absorption,” Analytical Chemistry 2.0 (Harvey), 10.2, P 5609
- H.K. Kim, J.G. Kim, J.D. Cho, J.W. Hong, “Optimization and characterization of UV-curable adhesives for optical communications by response surface methodology,” Polymer Testing 22 (2003) 899–906
- W. S. Chow, Y. P. Yap, “Optimization of process variables on flexural properties of epoxy/organo-montmorillonite nanocomposite by response surface methodology,” eXPRESS Polymer Letters Vol.2, No.1 (2008) 2–11


