


By Huan Lee and Stephen Pomeroy, Lambient Technologies
Abstract
High-speed dielectric cure monitoring has the unique ability to measure cure in real time under actual process conditions, which is valuable for studying materials that polymerize in seconds, such as H.B. Fuller U3345,1 the UV-curable adhesive used for this study. Under UV irradiation, U3345 reacts rapidly and exhibits dynamic behavior that would be difficult or impossible to see with other methods. The utility of dielectric cure monitoring allows measurement of the degree of cure and the response of UV-curable resins to irradiance and exposure.
Dielectric cure monitoring
Dielectric cure monitoring, also known as dielectric analysis (DEA), measures a polymer’s resistivity (ρ) and permittivity (ε’), which are a material’s dielectric properties. Resistivity itself has a frequency independent (ρDC) component due to the flow of mobile ions and a frequency dependent (ρAC) component due to the rotation of stationary dipoles.
Although often called DC resistivity, frequency independent resistivity actually extends across a range of frequencies that includes DC (0 Hz). Because a thermoset’s degree of cure affects both mechanical viscosity and frequency independent resistivity, the term ion viscosity was coined to emphasize the relationship between the two. Ion viscosity (IV) is therefore defined as:
Equation 1. IV = ρDC (ohm-cm)
This paper presents and discusses data for log(ion viscosity), which will be called log(IV) for brevity. At constant or near-constant temperature, the change in log(IV) often has a linear or near-linear relationship with the change in degree of cure, as measured by glass transition temperature and other methods.2,3,4 Because ion viscosity correlates with cure state, it is a useful probe of the material state of epoxies, polyurethanes, polystyrenes and especially UV-cured resins.
Dielectric sensors
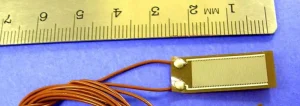
Dielectric cure monitors measure the resistance (R) and capacitance (C) of material between a pair of electrodes, which can be modeled as a resistance in parallel with a capacitance. A common configuration is the comb structure or interdigitated electrode, such as the example of Figure 1, the Quarto-Varicon5 dielectric sensor used in this study. This sensor is constructed as a thin polyimide flex circuit with an electrode width and separation of 100 microns.
As a rule of thumb, interdigitated electrodes with the same width and separation measure to a depth approximately equal to the electrode width. Consequently, the sensor used in this study makes a very localized measurement only 100 microns into the sample.
For UV curing, interdigitated sensors may be placed within a sample and away from the surface to avoid any confounding effects from oxygen inhibition, which prevents cure at the interface with the atmosphere.
Ultraviolet light source
The SunSpot 2 UV/Visible Light Curing System6 was the UV source for this study. The high-power output from its arc lamp is wide-band and intensity at the end of the light guide is typically >18,000 mW/cm2 in UVA (320 to 390 nm), with adjustable settings from I = 0 to I = 10 for intensity ranging from 60% to 100%, respectively, of full power.
This UV source uses both a dichroic filter and mirror to greatly reduce IR transmission through the light guide. Absorption of radiation in the remaining visible/UVA/UVB/UVC wavelengths, nevertheless, can produce considerable heating of samples at high irradiances.
Procedure
U3345 is a UV-curable, modified acrylate adhesive using a phenyl bis(2,4,6-trimethylbenzoyl)-phosphine oxide photoinitiator. After excitation, this photoinitiator undergoes cleavage to produce initiating radicals that drive cure. Since these photoproducts have reduced absorption in the visible/UV spectrum, the photoinitiator becomes bleached, enabling deeper penetration of UV and curing of thicker coatings.
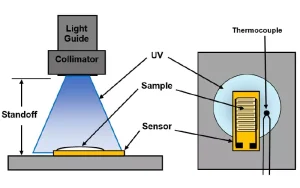
The experimental set-up is shown in Figure 2. At the end of the light guide, a collimator concentrated the light and projected it onto a platform for the sample. For each test, U3345 UVcurable adhesive was applied to a new dielectric sensor, resulting in a sample 7 mm x 20 mm in area and approximately 1 mm thick. The sample was placed on the platform at the estimated center of the irradiance profile. A thermocouple beside the sensor enabled temperature measurements during and after exposure.
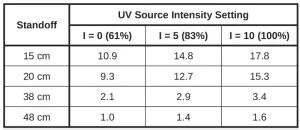
Each test used a standoff of 15 cm, 20 cm, 38 cm or 48 cm between the collimator and platform. UV source intensity was set to I = 0, 5 or 10, corresponding to 60%, 83% or 100% of full intensity, respectively. Lack of a UV meter prevented direct measurement of irradiance, so it was estimated from the rising and falling temperature profile during a test. These data were used to model a hypothetical thermal source for each exposure. The temperature of this hypothetical source was assumed to be proportional to actual irradiance at the sample and was used to derive the relative irradiances of Table 1. Without absolute UV power measurements, irradiance during a test was given a relative value from Table 1 to enable comparisons among results.
An LT-631 High-Speed Dielectric Cure Monitor7 measured ion viscosity with an excitation frequency of 100 Hz at a rate of 60 ms/data point. To ensure capture of the entire cure, the UV source was turned on five seconds after the start of data acquisition.
Cure from a single, low-intensity exposure
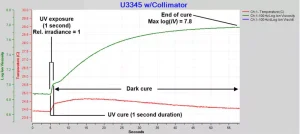
After a single exposure of U3345 to brief, low intensity UV, the ion viscosity and temperature were measured for 60 seconds. Standoff was 48 cm and the UV source intensity setting was I = 0 with an exposure time of one second. From Table 1 the relative irradiance = 1.0. Ion viscosity data from this test, shown in Figure 3, reveals three events:
UV cure during exposure. Before irradiation, the U3345 is at 0% degree of cure and the initial log(IV) = 6.9. During the one-second exposure, ion viscosity suddenly increases to log(IV) = 7.0 due to the curing process. Thermocouple temperature increases about 0.5°C due to absorption of light. Measured as the change in ion viscosity, cure is relatively slight, probably due to a time lag in the presence of activated photoinitiators at sensor level as they diffuse from the surface.
Dark cure after exposure. The activated photoinitiators continue to diffuse to the sensor and drive cure, indicated by the increase in ion viscosity, for a considerable time after UV exposure ends. As the photoinitiators are consumed, the cure process slows and ion viscosity asymptotically approaches a constant value. Because the sample is approximately 1 mm thick, cure should be both quicker and more complete near the surface, or quicker and more complete with a thinner coating.
End of cure. The asymptotic value of log(IV) = 7.8 at the end of cure, which occurs at approximately 60 seconds after exposure.
Cure from cumulative exposures
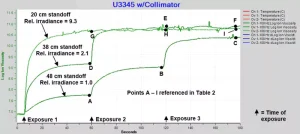
To investigate the effect of successive exposures, three samples of U3345 at different standoffs were exposed for one second at a time with UV source intensity = 0 and at one-minute intervals. The samples, which had standoffs of 48 cm, 38 cm and 20 cm, have relative irradiances of 1.0, 2.1 and 9.3, respectively, with each exposure. The results are shown in Figure 4.
The plot of Figure 3 actually is the first minute of the data in Figure 4 for a 48 cm standoff. Although the reaction in Figure 3 essentially ends after about 60 seconds, it is clear from Figure 4 that cure is incomplete at this point. Furthermore, the data show that maximum log(IV) after each incremental cure is proportional to the cumulative exposure. In each case, higher ion viscosity also corresponds to higher degree of cure.
The data show that two exposures at relative irradiance = 2.1 are sufficient to reach a plateau of log(IV) ~10.8, while only one exposure at relative irradiance = 9.3 is necessary. Also, once the plateau is reached, additional exposures do not change the ion viscosity level, indicating the U3345 has reached 100% degree of cure. It is important to note that Figure 4 describes the behavior of cure at the bottom of a 1 mm thick sample, with the cure rate there depending on the concentration of photoinitiators as they diffuse from the top. Coatings of different thicknesses would have different profiles of ion viscosity versus exposure and time, which in turn may yield information about diffusion rates.
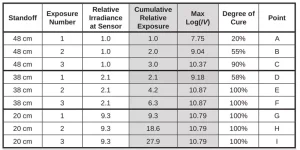
Table 2 lists the relative irradiances and cumulative relative exposures for each test. Max log(IV) is the value at the end of cure following each exposure and is indicated in Figure 4 as well as listed in Table 2. Figure 5 plots maximum log(IV) versus cumulative relative exposure.
Uncured resin with 0% degree of cure has a log(IV) = 6.9 and fully cured resin, presumed to be 100% degree of cure, has a log(IV) ~10.8. For many thermosets and polymers, the change in log(IV) is proportional to the change in degree of cure, therefore by interpolation it is possible to correlate cumulative relative exposure with both an ion viscosity and a degree of cure.
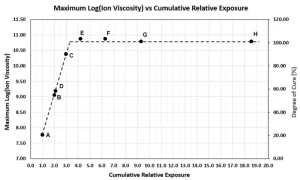
Figure 5 shows log(IV) and degree of cure increase in proportion to the cumulative exposure, until reaching a maximum value that corresponds to complete cure. This result is expected because the total amount of activated photoinitiator is proportional to the total irradiation, and the amount of activated photoinitiator, in turn, determines the extent of polymerization. If absolute irradiance could be measured at the sample, then it would be possible to relate cumulative exposure with the resulting degree of cure.
Cure inhibition from long exposures
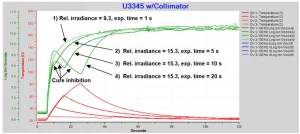
Curing behavior with long exposures may have significantly different dynamics compared to brief exposures. Figure 6 plots ion viscosity for four tests with increasing exposure times.
1) Relative irradiance = 9.3, exposure time = 1 s. Ion viscosity increases normally and monotonically through UV and dark cure to the plateau of log(IV) ~10.8, indicating a typical approach to 100% degree of cure.
2) Relative irradiance = 15.3, exposure time = 5 s. Ion viscosity shows a very slight knee at about 9 s (4 s after start of exposure) then a typical approach to 100% degree of cure.
3) and 4) Relative irradiance = 15.3, exposure time = 10 s and 20 s. Ion viscosity shows a pronounced knee at about 9 s (4 s after start of exposure) while temperature continues to increase significantly due to the intense light. Log(IV) decreases until the end of exposure at 10 s for curve 3, and 20 s for curve 4. Subsequently, dark cure proceeds to the ion viscosity plateau and 100% degree of cure.
This “knee” in ion viscosity has been observed in thermally cured resins (thermosets) if cure stops during an increasing temperature ramp.8 Ion viscosity is determined by both degree of cure and temperature, and has two basic behaviors:
- At constant temperature, ion viscosity increases as degree of cure increases.
- At constant degree of cure, ion viscosity decreases (increases) as temperature increases (decreases).
Normally, log(IV) increases as cure advances, and in most cases this response dominates even as temperature increases. However, if cure stops while the temperature continues to increase, then the degree of cure is constant, and ion viscosity decreases, resulting in the “knee.”
Similarly, for U3345, the knee in log(IV) – slightly visible for curve 2, prominent in curve 3 and even more prominent in curve 4 – indicates polymerization has stopped. In fact, cure has been temporarily inhibited, because ion viscosity increases again after exposure ends and the U3345 undergoes dark cure.
Since ion viscosity in Figure 6 reaches the maximum value of ~10.8 (100% degree of cure) for each of the four curves, the U3345 has experienced only a delayed time to end of cure for the 5-, 10- and 20-second exposures. This cure inhibition may be a general phenomenon because it has been observed in all of four UVcured resins examined to date.
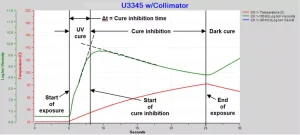
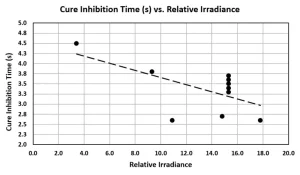
It is difficult to determine a precise time for the start of cure inhibition, but it can be estimated by the intersection of asymptotes on either side of the knee, as shown in Figure 7. Cure inhibition time is defined as the difference between the start of exposure and the start of cure inhibition. Figure 8 plots the cure inhibition times for several tests across a range of irradiance. The quantity of activated photoinhibitor increases with irradiance, and the trend line of Figure 8 shows increasing irradiation corresponds with shorter inhibition times. This relationship suggests a connection between the level of activated photoinitiator (or, conversely, photoinitiator depletion) and the onset of cure inhibition.
Cure inhibition cannot be due to the depletion of activated photoinitiators because dark cure indicates the continued presence of initiating radicals. It is possible cure inhibition results from high exposures that generate too many initiating radicals, which encounter and cancel one another. High exposures also may create excessive amounts of short polymer chains and no long ones. Perhaps bleaching of all photoinitiators eliminates screening of UV radiation from the monomers, causing them to absorb UV photons and become too energetic to bond. Although the cause of cure inhibition is not yet known, further study may yield interesting information about photoinitiator chemistry.
Cure degradation from long exposures
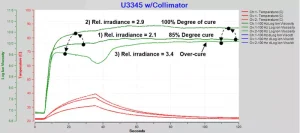
Long exposures with high irradiances risk over-cure and degradation of a UV-cured adhesive. Figure 9 shows the progression over three tests of increasing irradiance with an exposure time of 30 seconds.
1) Relative irradiance = 2.1, exposure time = 30 s. Normal cure but total energy is only sufficient to achieve final log(IV) = 10.2 and degree of cure = 85%.
2) Relative irradiance = 2.9, exposure time = 30 s. Normal cure and total energy sufficient to achieve final log(IV) = 10.7 and degree of cure ~100%.
3) Relative irradiance = 3.4, exposure time = 30 s. Cure shows cure inhibition and over-cure from excessive total energy, resulting in reduced final log(IV) = 10.1 and degradation.
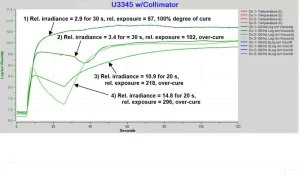
Compared to the value at 100% degree of cure, a reduction in final ion viscosity, despite greater irradiance, indicates the presence of damage. Lower ion viscosity is the result of greater conductivity (lower resistivity) due to degradation byproducts and broken bonds. Figure 10 shows four tests with varying irradiances and exposure times. Lack of absolute UV power measurements necessitates use of relative exposure, given by Equation 2, to allow comparison among tests:
Equation 2. Relative exposure = Relative irradiance • time (s)
Test 1, with a relative exposure = 87, shows normal cure that achieves log(IV) ~10.7 and ~100% degree of cure. Tests 2, 3 and 4 have higher relative exposures but lower final ion viscosities, with log(IV) ~10 – a clear sign of degradation. Additional evidence of degradation are irregular features such as the dip starting at 30 s in Test 2.
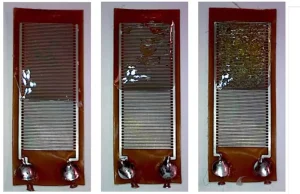
Figure 11 shows the effect on UV-cured resin with different degrees of exposure. Extreme deterioration (Figure 11 b and c) is apparent as voids from overheating. More subtle degradation is visible as yellowing or discoloration, which may be faint or subjective. Dielectric measurements, however, can provide a supplemental, objective measure of damage caused by overexposure.
Conclusion
Real-time dielectric cure monitoring (DEA) of UV-cured resins can complement traditional laboratory tests to relate degree of cure and exposure energy, measure the effect of formulation on cure and identify degradation from overexposure. The ability of dielectric cure monitoring to capture events in real time allows observation of transient phenomena such as cure inhibition, which appears to be a response of UV-cured resins in general to very long exposures.
Acknowledgements
The authors would like to thank Uvitron International for the SunSpot 2 UV Spot System and H.B. Fuller for the UV-curable materials used in this study. In addition, we would like to thank Martin Thompson of Domino Printing for comment and discussion.
References
- U3345™ UV-curable adhesive, manufactured by Cyberbond Europe GmbH, Wunstorf, Germany https://www.cyberbond.de/en/products/uv-products/table/.
- Application Note 3.22, “Cure Index and Degree of Cure,” Lambient Technologies, Cambridge, Massachusetts, US.
- J.H. Chen, M.A. Octeau, M. Hojjati and A. Yousefpour, “Cure Cycle Optimization for Composite Panels Fabricated by RTM Using Dielectric Sensors,” National Research Council Canada, Institute for Aerospace Research, ICCM International Conferences on Composite Materials (2009).
- Day, D.R., “Dielectric Determination of Cure State During Non-Isothermal Cure,” Polymer Engineering and Science; 29(5):334-338, (August 2004).
- Quarto-Varicon™ sensor, manufactured by Lambient Technologies, Cambridge, Massachusetts, US. https://lambient.com
- SunSpot 2™, manufactured by Uvitron International, Inc., West Springfield, Massachusetts, US. www.uvitron.com
- LT-631™ High Speed Dielectric Cure Monitor, manufactured by Lambient Technologies, Cambridge, Massachusetts, US.
- Application Note 3.21, “Measuring Degree of Cure with Dielectric Cure Monitoring,” Lambient Technologies, Cambridge, Massachusetts, US.


