A key objective for this column is to provide technical personnel in the UV/EB industry with some of the fundamentals of polymer science so they can develop a deeper understanding of the chemistry and technology of materials they are working with every day. The 4th Quarter, 2019 column addressed various factors that chemists, chemical engineers and materials scientists can, in principle, manipulate to achieve desired polymer properties.1 An important factor referred to in that article, but not discussed, was molecular mass and its corresponding molecular mass distribution. This magazine’s column will address that issue.
Unlike low molecular mass compounds in which all the molecules essentially are identical in molecular mass (other than for minor isotope effects), the macromolecules making up polymeric materials typically show significant variation in molecular mass. Thus, a single molecular mass value is of little use; rather, a much broader understanding involving molecular mass averages and molecular mass distribution is needed.
Several molecular mass averages are calculated or measured for polymers. The three most common are number average (Mn), weight average (Mw) and z-average (Mz). Let’s focus attention on the first two of these.

Figure 1 provides a hypothetical problem to illustrate a particular polymer’s molecular mass distribution. First, note that this example has a single maximum in the graph. Thus, it is referred to as a “monomodal” molecular mass distribution. Also, note that this polymer has a distribution of macromolecules with very different molecular masses, ranging from 60 000 atomic mass units (u) to 120 000 u. Each “x” in the graph represents an individual macromolecule.
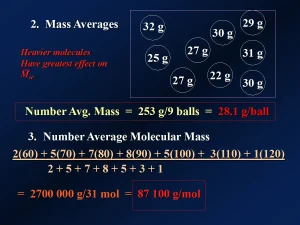
Figures 1 and 2 give examples of how a number average is calculated. The first example simply gives a series of numbers that are averaged in the standard way: Take the sum of all values and divide that by the total number of values present – [84/8 = 10.5]. The second example demonstrates the calculation of a number average mass for a set of balls: Add the masses together and divide by the number of balls – [253 g/9 balls = 28.1g/ball]. Finally, the third example shows the calculation of the Mn for the polymer sample represented in Figure 1: The total mass of all macromolecules is calculated and then divided by the total number of molecules – [2700 000 u/31 macromolecules = 87 100 u/macromolecule = 87 100 g/mol].
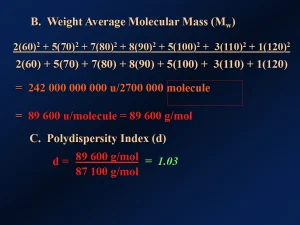
The Mn for a polymer is influenced heavily by the less massive molecules since every molecule counts equally in the calculation. But the heavier macromolecules may have a greater effect on the properties of the polymer than will the lighter ones. To generate an average that more accurately depicts this reality, one can calculate the weight average molecular mass (Mw). In effect, this approach gives more “credit” to heavier macromolecules than to lighter ones. Figure 3 provides the calculation for Mw for the example in Figure 1 – [89 600 u/molecule = 89 600 g/mol]. Figure 3 also shows a calculation that gives some indication of how broad the molecular mass distribution is. This calculation involves dividing the Mw by the Mn to give the “polydispersity index” – [d = Mw/Mn = 89 600 u/87 100 u = 1.03]. This indicates a relatively narrow molecular mass distribution in this hypothetical case.

Figure 4 shows a schematic depicting the Mn and the Mw within a graph of a molecular mass distribution for a polymer. Note that as for the graph in Figure 1, this graph has a single maximum, meaning the molecular mass distribution is “monomodal.” Also, note the Mw is greater than the Mn. This is true for virtually all polymers except for certain proteins or other natural polymers wherein the Mn = Mw. All the macromolecules in such systems have the same molecular mass and are said to be “monodisperse.”
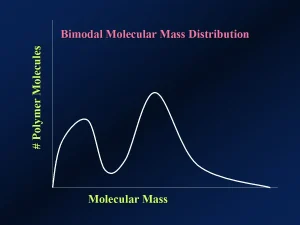
Figure 5 shows a “bimodal” molecular mass distribution. Even in the unlikely case of identical Mn and Mw values among polymers of differing “modality,” one would expect their properties to be different.
Now it is important to point out that these discussions refer to linear or branched polymers having distinct macromolecules that can, in principle, be dissolved with appropriate solvents in order to measure the molecular masses using techniques such as size exclusion chromatography (SEC), also known as gel permeation chromatography (GPC). All practical UV/EB polymers, on the other hand, are crosslinked. Such polymers cannot be dissolved or melted because to do so would require the breaking of chemical bonds. So, it isn’t feasible to directly measure the molecular mass of a crosslinked polymer. Conceptually, crosslinked polymers can be thought of as consisting of a single molecule. Assuming no imperfections at the molecular scale, such a system should have an unbroken chain of covalent or polar covalent bonds from one side of the sample to the other. Let’s assume a sample of a crosslinked polymer film is a single molecule weighing 0.0050 g. Now calculate its molar mass:
[0.0050 g/1 molecule][6.022 x 10²³ molecules/mol] =
3.0 x 10²¹ g/mol ≈ ∞
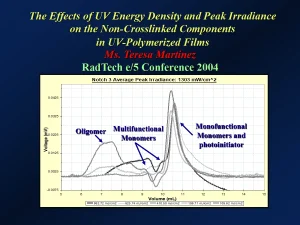
Crosslinked polymers, then, have a very large molecular mass that is effectively unmeasurable. However, if the films are soaked in an appropriate solvent, then low molecular mass components of the films – such as unreacted monomers and photoinitiators or other oligomeric components that are not tied into to the crosslinked network – can be extracted from the film and their molecular masses determined experimentally. An example of this type of extraction study was reported by Teresa Martinez at the 2004 RadTech e/5 Conference in Charlotte, North Carolina.2 In that study, researchers used SEC to analyze the non-crosslinked components of a UV-polymerized film. They were able to extract and analyze unreacted oligomer, multifunctional and monofunctional monomers, and unreacted photoinitiator. Figure 6 shows a chromatogram that resulted from the research. This lab technique involves separating extracted components by molecular size – the larger components elute first and then smaller ones.
References
- Professor’s Corner”, UV+EB Technology, 5, No. 4, 4th Quarter, 2019, pp. 12-13.
- Teresa Martinez & Byron Christmas, “The Effects of UV Energy Density and Peak Irradiance on the Non-Crosslinked Components in UV-Polymerized Films”, Proceedings, RadTech e|5 Conference, Charlotte, NC, 2004.
 Byron K. Christmas, Ph.D.
Professor of Chemistry, Emeritus
University of Houston-Downtown
b4christmas@gmail.com