

In the last issue of UV+EB Technology, we began a discussion about the preparation of nanocomposites made by incorporating carbon nanotubes into UV-polymerizable formulations. 1 That article covered the experimental techniques used by students at the University of Houston-Downtown 2 to determine how well single-walled carbon nanotubes (SWNTs) were dispersed (exfoliated) in an acrylate-functional medium. This included visible/near infrared (Vis/NIR) spectroscopy and rheological studies. In this issue, we will review the work done to investigate the effects of SWNTs on the reactivity of the formulations using differential photocalorimetry (DPC) and on the thermal and thermomechanical properties of the nanocomposites using differential scanning calorimetry (DSC) and dynamic mechanical analysis (DMA).
Effects of SWNTs on Reactivity
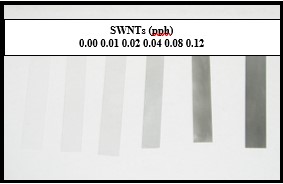
One would expect carbon nanotubes to absorb visible and UV energy in proportion to their concentration in the formulation. Qualitatively, the absorption of visible light is indicated by the fact that as the concentration of SWNTs in the formulations was increased, the cured films became distinctly darker and more opaque. This is illustrated in the photograph shown in Figure 1. With increasing concentration of SWNTs, the absorption of UV energy also is expected to increase, causing a reduction in photons available for absorption by the photoinitiator. This, then, should reduce the reactivity of the formulation.
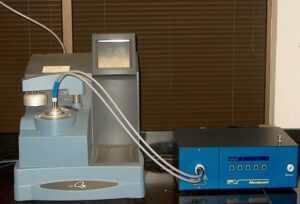
To measure the relative reactivity of UV-polymerizable systems, differential photocalorimetry (DPC) is useful. In this research, a DPC unit from TA Instruments was utilized. A picture of this unit is shown in Figure 2. The instrument shown on the left is a DSC unit that is connected via two waveguides to the UV source. One waveguide is centered over a very small sample (~0.5 g) of the liquid formulation and the second one is centered over an empty sample pan that is used as a reference. The DSC unit holds the temperature constant throughout the scan and measures the amount of thermal energy emitted during the polymerization as a function of time. An example of the output of this instrument is shown in Figure 3. This DPC scan is for the control sample containing no SWNTs. Note that there is a slight delay from the time the shutter is opened until the exotherm begins. This is indicated at the lower left of the curve and reflects the induction time – the time during the polymerization when the inhibitory factors in the formulation are being overcome. Following this, a sharp increase in the exotherm is observed. The height of the resulting peak indicates the maximum rate of evolution of thermal energy in mW or mJ/s. The higher the peak, the faster the reaction is once the induction process is complete. The peak max time is the time it took for the peak maximum to be achieved.
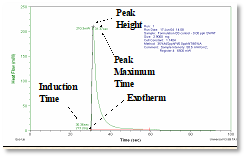
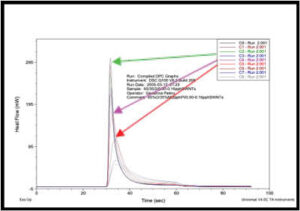
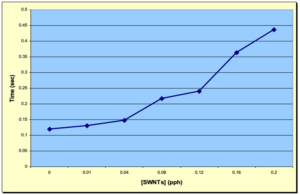
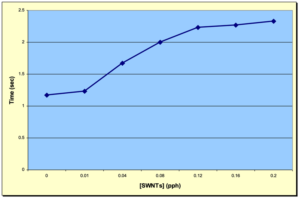
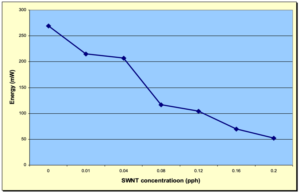
Figure 4 depicts an overlay of the DPC scans of the SWNT samples investigated in this study for concentrations ranging from 0.00 to 0.20 pph SWNT. As expected, the induction time and the peak max time both increased with increasing SWNT concentration, while the peak height decreased. These trends are shown in Figures 5, 6 and 7, respectively, and indicate that as the concentration of SWNTs increases, the reactivity of the formulations decrease uniformly. In spite of this negative effect on reaction rate, all the films, including the one containing 0.20 pph SWNT, were fully polymerized from top to bottom.
Effects of SWNTs on Thermomechanical Properties
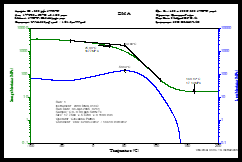
Dynamic mechanical analysis was used to evaluate the thermomechanical properties of the films containing 0.00 to 0.16 pph SWNTs. Figure 8 shows a DMA scan for the control sample. The storage modulus as a function of temperature is shown in the upper green curve and represents the “solid-like” properties of the polymer. The loss modulus is shown on the lower blue curve and represents the “liquid-like” properties. A summary description of the DMA process is given in the 2nd Quarter, 2022 issue of UV+EB Technology. 3
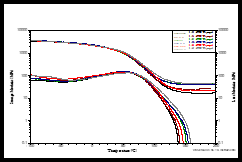
For the study being reviewed here, the glass transition temperature (Tg) of the control sample was recorded using the alpha-transition for both the storage and loss moduli and was determined to be ~50° C. Using this criteria, one can see in Figure 9, which is an overlay of DMA scans for all the samples, that the Tgs all appear to be about the same, indicating that the effect of SWNT concentration on the Tg is minimal. However, it now is generally accepted that a different parameter produced by the DMA more accurately represents the Tg. This is the peak of the “tan d” curve, a parameter that in simple terms is the ratio of the loss to storage moduli at the temperature corresponding to the peak. Since those data were not determined in the study, it isn’t really possible to know what the trends in the Tg were with increasing levels of SWNTs.
The overlay of scans in Figure 9, however, does provide insight into the effect of the concentration of SWNTs on the cross-link density of the films. This information comes from the divergence observed for the different samples in the so-called “rubbery plateau” of the storage modulus. This is the area of the curve above the Tg. In this region, the storage modulus becomes independent of temperature due to the fact that the network 3D-structure of the cross-linked polymer has been stretched to its limit; further stretching would cause bond breakage and decomposition. While the 0.08 pph sample appears to be an anomaly, in general an increase in SWNT concentration does appear to increase the cross-link density of the polymer.
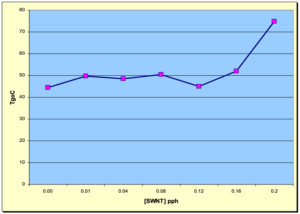
To gain some insight into the effect of SWNT concentration on the Tg, thermal analysis using DSC methodology was evaluated in the study being reviewed. Figure 10 depicts a graph showing the Tgs of the various samples from 0.00 to 0.20 pph SWNT. Interestingly, the samples from 0.00 pph up to 0.16 pph concentration do, indeed, indicate that the Tgs were ~50° C with little or no variation with SWNT concentration. However, at 0.20 pph concentration, the Tg increased significantly to around 75° C! If one assumes that Tg would increase with crosslink density, then this appears to be consistent with the DMA results. Perhaps this indicates that the SWNTs at some critical concentration (0.16 pph?) begin to interact more strongly with the polymer matrix causing more restriction to the “on-set of segmental motion.” 4
In summary, the work reviewed in the last two issues of “Professor’s Corner” indicates that incorporation of SWNTs into UV-polymerizable systems can be done using relatively simple methods. It also indicates that while there is a slight negative impact on reactivity, good through-cure is feasible in spite of the absorption of UV energy by the nanotubes. Finally, very interesting thermal and thermomechanical properties can be expected from such a process.
Technical Questions?
What are your technical questions about polymer science, photopolymerization, or other topics concerning the chemistry and technology of UV/EB polymerization? Please submit your questions or comments via e-mail to Dianna Brodine, Vice President, Editorial, Peterson Media Group, at dianna@petersonmg.com or to me at b4christmas@gmail.com.
References
- “Professor’s Corner,” UV+EB Technology, Vol. 9, No. 3, pp. 16 & 17.
- V.Lam, G. Patino, C. Carandang, & B. Christmas, “UV-Polymerizable Systems Containing Single-Walled Carbon Nanotubes,” http://www.radtech.org/proceedings/2006/papers/093.pdf – Accessed September 28, 2023.
- “Professor’s Corner,” UV+EB Technology, Vol. 6, No. 2, pg. 13.
- Stevens, Malcolm P., Polymer Chemistry: An Introduction, 3rd Edition, 1999, p. 70.
 Byron K. Christmas, Ph.D.
Professor of Chemistry, Emeritus
University of Houston-Downtown
b4christmas@gmail.com


