


This is the next installment in the ABCs of UV Measurement and Process Control Series of columns.
Bands (UV)

It is human nature to categorize things. The electromagnetic (EM) spectrum is categorized from short, high-energy gamma rays to long, low-energy radio waves. Most people are familiar with the visible portion (+/- 400-750 nm) because of the associated colors we see from red to violet (ROYGBIV). As the wavelengths increase, gamma rays transition to X-rays, ultraviolet, visible, infrared, microwave and radio waves.
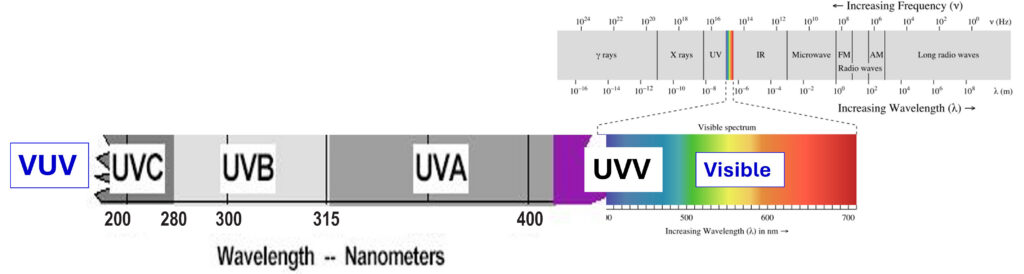
UV energy is categorized as energy between 10 nm and approximately 400 nm. “Letters,” a possible carryover from medical terminology, often are used to identify the different UV bands (Figure 1). The actual (nm) range for each band may vary slightly depending on the reference cited. Starting with the shorter wavelengths, UV is described as follows.
V-UV (Vacuum UV) 10-200 nm. Sometimes subdivided into “extreme” (10-100 nm) and “far” (100-200 nm) UV, the wavelengths in this region are strongly absorbed by air, specifically oxygen. V-UV is used in semiconductor photolithography, spectroscopy and photochemical surface cleaning. UV energy at 172 nm, produced by an excimer source, can be used alone or in conjunction with electron beam (EB) energy to modify surfaces in products like wood flooring.
UV-C 200-280 nm. Short-wavelength UV is the most intense energy that can travel through air. From a curing standpoint, UV-C is important for surface cure and resulting properties, such as tack, chemical, stain or scratch resistance. UV-C is the first wavelength to drop off when UV reflectors become hazy or dirty. UV-C energy, primarily at 254 nm, has the ability to disrupt DNA replication and commonly is used in germicidal applications.
UV-B 280-315 nm. Medium-wavelength UV is filtered partially by the atmosphere. In curing applications, UV-B is an important wavelength and often gives coatings their “toughness” and “durability.” UV sources need to be properly shielded, as UV-B has the potential to affect skin and, in the long term, is responsible for causing damage/cancer. Controlled amounts of UV-B often are used in medical phototherapy.
UV-A 315-400 nm. Long-wave UV sometimes is called “black light.” UV-A is the workhorse in curing applications. UV-A is the band often responsible for curing and adhesion.
UV-V 400-445+ nm
Longer wavelengths are a combination of ultraviolet (UV) and visible (V) energy and give this band its name. The longer UV-V wavelengths provide depth of cure and adhesion for thicker and opaque/white coatings. They often are emitted by broadband mercury-gallium bulbs or by longer-wavelength (395/405 nm) LEDs. Do not confuse UV-V (UV-Visible) energy with V-UV (Vacuum UV) energy.
The combination of UV delivered must be matched to the photoinitiator(s) in the formulation to provide the desired cure characteristics in the final product.
Practical Tip: Use an instrument matched to your source and application. Make sure the instrument measures the UV bands relevant to your application/process.
Bandwidth
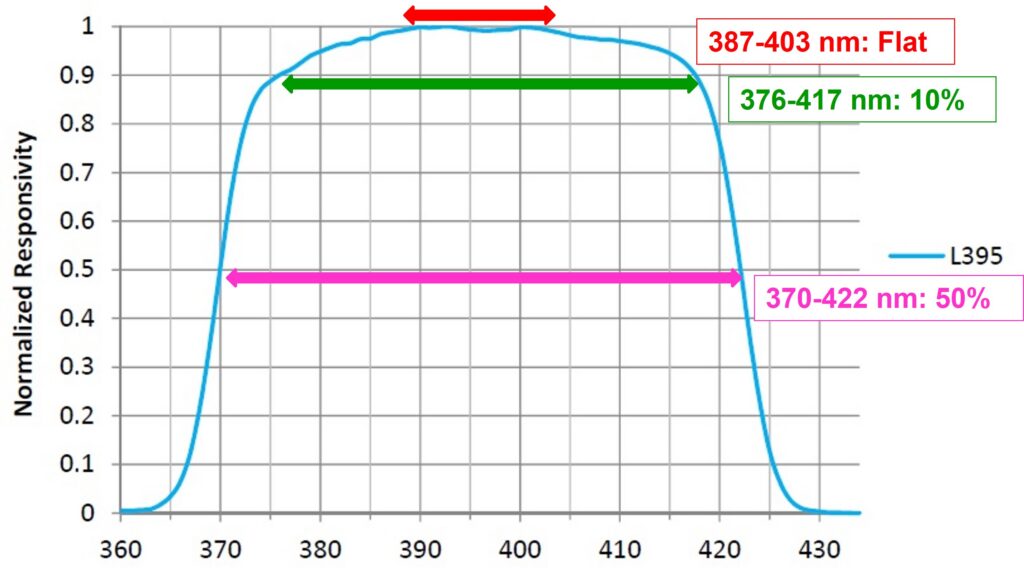
This is the “width” of the instrument response, expressed in nanometers (nm). Instrument manufacturers decide:
- The “width” of the band. Some bandwidths are “narrow,” and some are “wide.” There are advantages and disadvantages to each type of approach. Examples are 320-390 nm or 250-410 nm.
- The shape of the bandwidth and whether it is “flat” or has one area that is more responsive (Figure 2).
- What the bandwidth “number” means. Some manufacturers use a 50% point (Full Width Half Max [FWHM]) to define the response, while others use a 10% point of the full response.
- If the described “bandwidth” is the optical filter response, all instrument optics in the instrument or a select combination.
- Calibration process: Is the instrument calibrated over the entire bandwidth response, or in the case of a “wide” band, at just one point?
- The source used for calibration.
- How many bands are included in an instrument, with one or four bands being common options.
Practical Tip: Instruments with multiple bands help identify bulb types (see Additive Lamps). Tracking the UV-A:UV-C ratio can alert users to changing (dirty) reflector conditions when the UV-C reading drops compared to the UV-A reading.
Bulb
Is it a lamp or a bulb? When I asked this question many years ago, an industry veteran pointed at a table lamp and asked me to apply the same logic to a UV system. The “lamp” is everything (fixture, switch, shade, bulb, cord). For a UV system, the “lamp” or “lamp system” would include power supply, cables, reflector, cooling, housing, shielding and bulb. In both examples, the “bulb” is the item replaced that generates the light and/or UV. For describing LED systems, I usually use the term “array.”
Practical Tips:
- Whatever terms you use, speak the same language in your facility and with your suppliers.
- Specify the lamp types needed as part of your process design, and pair them with the photoinitiators in your formulation.
Calibration and Service
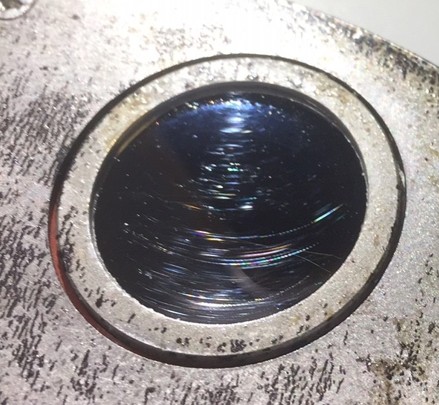
UV measurement instruments are used in harsh conditions and exposed to UV, visible and infrared energy. Production environments add the possibility of physical damage to the instrument (Figure 3) as well as contamination of the optics. Periodic calibration and service to adjust the unit back to the original factory settings ensure proper unit operation.
Practical Tips:
- Use the original manufacturer or a service facility authorized by the manufacturer for calibration.
- Follow the calibration interval suggested by the instrument manufacturer.
- Refer to the “As Found” data on your calibration certificate, and the variables below determine if the calibration interval can be adjusted to more or less frequently.
Variables that can impact unit performance and require more frequent calibration include:
- Frequency of readings, UV intensity and the heat/infrared the unit encounters.
- Instrument care, including handling, cleaning of optics and contamination.
Communication
Successful UV curing requires communication. Use your radiometer values to communicate, making sure you are communicating in the same radiometer language. Communicate with the following suppliers:
- Formulator (Ink, Coating, Adhesive)
- Application Equipment
- UV Source Supplier
- Substrate Supplier
- UV Measurement Supplier
Don’t forget to communicate within your facility and, if applicable, between different company facilities.
Cosine Response
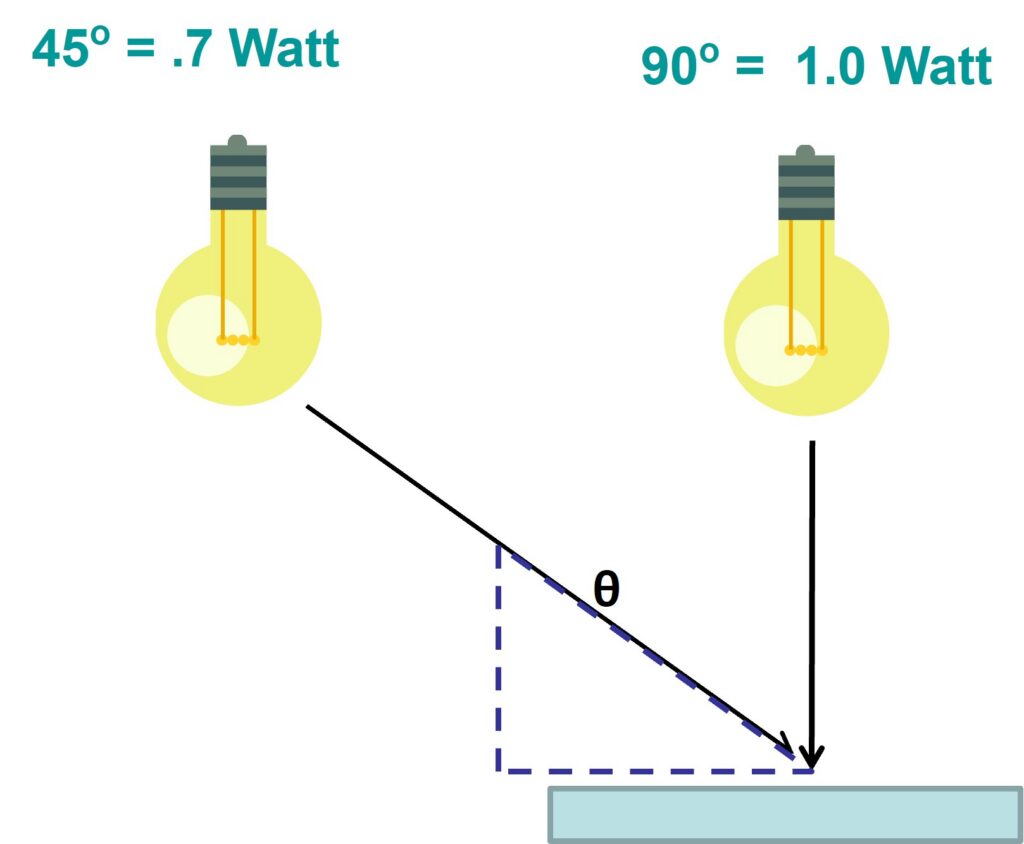
The optics in UV instruments are designed to replicate a cosine response, as most UV coatings are thought to respond in this manner. The instrument response is proportional to the cosine of the incident angle of the UV photons, as shown Figure 4. Most instruments do a respectable job of replicating this response until very low incidence angles are reached.
Data Collection Techniques and Data Organization

Consistent data collection techniques produce better data. Confirm that you have the correct instrument, spectral response, dynamic range and settings. A written procedure will help get more consistent data. Decide how frequently you will take readings, paying attention to instrument position and equipment settings. Let the UV source warm up. Make sure the optics are clean and decide what parameters will be recorded. A spreadsheet or table on a clipboard often works well. Make sure a radiometer is available when it is needed, and do not rely on a radiometer that is borrowed from a formulator every once in a while.
Dichroic Materials (Cold and Hot Mirrors)
Dichroic materials reflect a specific range of wavelengths while transmitting other ranges. In the UV industry, dichroic materials are used to enhance reflectors. The two types most often used:
- Cold Mirrors:Reflect UV and/or visible wavelengths more than the longer infrared (IR) wavelengths. Cold mirrors work to reduce the heat and may be beneficial in temperature-sensitive applications such as films.
- Hot Mirrors: Reflect the longer wavelengths like IR more than the shorter UV and/or visible wavelengths. Heat usually is increased, and it may be beneficial to help the UV reaction in some applications.
Dose
The term “dose” commonly is used in UV curing. The definition of “dose” is energy absorbed per unit mass, with “absorbed” being the key word. In EB curing, dose is defined as 1 gray (Gy) = 1 J/kg = 0.1 Mrad. For UV curing, the terms “energy” or “energy density” are preferred, as they refer to the energy measured at the surface rather than the energy absorbed. If you elect to use the term “dose” for UV curing, be sure to communicate that the units are J/cm2 at the surface and not absorbed (Gy, Mrad) units used for EB curing. Please refer to Energy Density in the next column.
Dynamic Range
For a radiometer, the dynamic range refers to the minimum and maximum irradiance values (W/cm2) that yield the best results. This is the most common customer question. The easiest analogy to understand dynamic range is weight. For best results, a baby needs to be weighed on a scale optimized for a baby, and a truck needs to be weighed on a scale optimized for a truck. Poor results are possible if the wrong weight scale is used.
The following are examples of three suggested dynamic or operating ranges for the EIT 2.0 UV-A band:
- 10-Watt High Range: 100mW/cm² to 10W/cm²
- 1-Watt Mid-Range: 10mW/cm2 to 1W/cm2
- 100 milliWatt-Low Power: 1mW/cm² to 100mW/cm²
The suggested operating ranges are where the instrument performs best. Units will “turn on” and display data at irradiance values much lower than the suggested operating ranges listed above.
- Using a radiometer optimized for a high dynamic range on a source with low irradiance values could lead to erratic readings, especially in the Joules, or the instrument not “seeing” enough UV to turn on.
- Using a radiometer optimized for a low dynamic range on a source with high irradiance values could lead to the instrument “maxing out” on each measurement. The source would look very stable, and the values would be under-reported.

Jim Raymont
Director of Sales
EIT 2.0 LLC
jraymont@eit20.com