


By Paul Snowwhite, Katie Snowwhite and Hunter Peczynski, 7D Innovators, LLC
Editor’s Introduction: The authors created an experiment to better understand why 3D printers created by various manufacturers perform differently even when using the same print settings or why a print fail occurs after multiple successful prints. Variables initially considered included material, cure source and printer calibration, but what emerged were concerns about consistent radiometry data across the width of the print platform. With better understanding of 3D printers, the ability to develop high-quality materials will be enhanced.
Background of 3D Printing
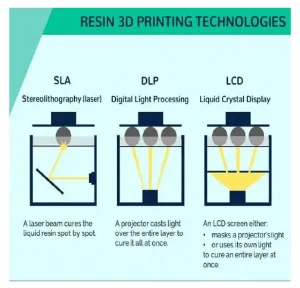
In the industry of additive manufacturing, 3D printers vary not only in the material used for printing – whether they print resin, filament or even cement – but also in how things get printed, with differences in positioning or curing sources. Three types of resin 3D printers are addressed in this article: stereolithography (SLA), digital light projector (DLP) and liquid crystal display (LCD). SLA, DLP and LCD printers (Image 1) use a process called vat polymerization to cure the resin into layers by using a resin tank and a certain type of light source.
SLA started to be commercialized in the mid-1980s and uses a laser beam to selectively cure layers of resin on the bottom of the resin tank that then adhere to a print platform. The laser works by using galvanometers, which are little mirrors under the resin tank, to guide the laser to the precise position that needs to be cured. In DLP 3D printing, a digital light projector is used to cure the layer of resin simultaneously, using the color black or no light at all to get precise layers. LCD printers use light emitting diodes (LEDs) that shine through LCD panels to cure the current layer of resin. LCD printers are the focus here.
LCD Printers with LED Light Sources
Liquid Crystal Display (LCD) printers have become a popular option for 3D printing as they provide a high-quality product while also being cost effective. LCD 3D printers take advantage of the light-modulating properties of liquid crystals when placed between crossed polarizers and clear electrodes. When a field is applied, the crystal molecules align and, depending on the orientation of the polarizers, light can pass or it is blocked. An array of UV LED panels is used as a cure source, only allowing UV to pass through where resin needs to be cured, reducing the need for galvanometers or mirrors and simplifying the printing process. LCD-based printers have a print quality that depends on the LCD density. The more pixels a display has, the better the quality of the print. LCD printers are scalable in a way DLP printers are not.
A common problem with LEDs is that they start to dim as they come to the end of their lifespan, which is unlike traditional light bulbs that burn out all at once. Each LED will age differently due to manufacturing (high-quality LEDs can have a long lifespan and fairly predictable degradation over time), and there are thousands of LEDs within a singular array. Small imperfections in the LED-chip semiconductor crystals can cause the LED to begin losing brightness. LEDs let out a small amount of heat when turned on and improper cooling can increase the rate of decay.
According to online reference ledlights.org, “The term degradation in connection with LED lighting describes the decrease in luminous flux over the course of a lifetime. The luminous flux slowly decreases due to material changes in the LED chip and clouding of the optics. Degradation is therefore an aging process in which an LED lamp loses its brightness over time and slowly becomes darker.”
Printer Consistency Issues and Observations
When 3D printing, there are many parameters that need to be met for a successful print to take place. Print failures can occur due to incorrect settings, support placement or equipment that needs calibration. Through their use of 3D printers, the authors have seen how important it is to include radiometry in the conversation about print issues.
When printing, failures have been observed on printers that had been consistently printing, were calibrated, had been cleaned, had correctly inputted settings and were using a known material. Sometimes these print fails were minor – such as a deformed support or an unlevel surface that was able to be sanded smooth – however, other times it would be a complete failure, with no model attached to the print platform or half the model missing. After a while, with these failures seemingly coming out of nowhere, it was time to begin investigating and learning more about the 3D printers being used.
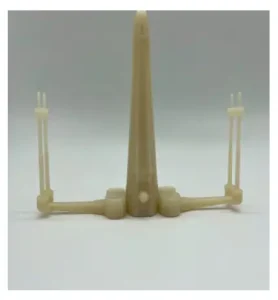
It was observed that lifting and uneven models mostly were printed if they took up a majority of the print platform or were placed close to the edges. The starship in Image 2 is a good example of what it looks like when the print is lifting. This print took up most of the print platform horizontally, and the edges of the print lift more as it gets closer to the edges of the platform.
Some 3D printer manufacturers offer replacement screens and instructional videos for their printers due to these inconsistency issues. Other 3D printing companies don’t offer a replacement option. While it’s understandable that companies don’t want untrained users trying to do their own printer repairs and (possibly) worsening the problem, acknowledging the problem and addressing it would be ideal.
Purpose of Experiment
One of the reasons this experiment was designed is because the authors started to notice that a print would fail on one printer, but it would print perfectly when tried on a different printer from the same manufacturer with the same print settings. In looking for the cause of this inconsistency, variables such as material, cure source and printer calibration were reviewed. In the past, there had been issues with prints peeling up at the edges, but those were attributed to not having a high-enough bottom exposure level. As more research into 3D printers was done, the authors learned that LED-curing arrays begin to dim, which causes them not to work at 100% power consistently or can cause inconsistency of cure over the whole screen.
Overall, the main reason for this experiment was to do more research to better understand the printers, find out why there are inconsistencies in print quality and explain the reasons for a print fail after multiple successful prints when there are no obvious reasons for failure. Material developers need to understand these things to develop materials at the highest quality possible for this industry.
Procedure and Equipment
A UV meter (radiometer) was used to measure the output of curing sources in the operation of 3D printers from a variety of manufacturers. The first step was making sure the radiometer was on and in the correct parameters (uW/cm^2) for this experiment. While wearing proper PPE, the display was turned on or the print was started, depending on the printer. Then, the probe was placed on the printer’s screen to take a measurement of the UV output, running the probe for five seconds and recording the data. The process then was repeated and, depending on which measurements were being taken, the probe was kept in the same spot for more readings or moved to another spot on the printer’s screen and data was recorded. The spot size of the probe was 1 cm in diameter. The average of three measurements was used to get the data reported for each particular printer.
To understand any variations that might occur, multiple spots across a printer’s surface were measured – center and edges. The middle measurement for every printer was taken at the center of the screen, a fixed point. For left and right measurements, the size of the printer’s screen had to be considered. To get these measurements, the probe was placed so that the outside edge of the probe aligned with the edge of the screen while being along the same horizontal line of the center measurement. This was done for both the left and right measurements.
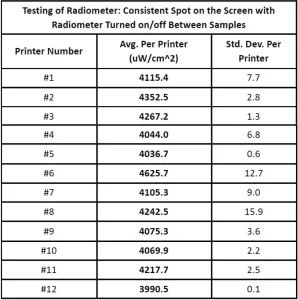
The precision of the radiometer also was evaluated to ensure accuracy. Several experiments were done to understand the variation with respect to measurement. These were done by measuring printers in the same spot 180 times between three different printers with the radiometer cycled on and off without moving the probe (Table 1). As can be seen, the radiometer’s measurements are extremely consistent with low variability. It also is important to note that all printers tested were within the specification per the manufacturer at the time testing was performed.
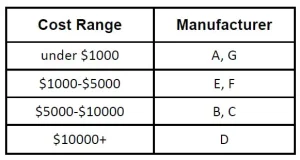
For the experiments performed, several printers were used. As the commercial cost range data show in Table 2, some printers tested were on the lower end and some on the higher end. The printers varied in how they allowed radiometry testing as well; some give measurement internally, but most don’t, and some have an option to test the array’s power without an actual measurement produced.
The point of this experiment was not to evaluate which printer or manufacturer had the best printer, but to create discussion about radiometry and 3D printing. Letters have been assigned to the printers within this experiment, and the printers have been categorized by cost in ranges to give a scope of understanding for readers.
Challenge in Measuring Energy Outputs
When beginning the testing for this experiment, it was observed that some manufacturers allow users to check the exposure levels and/or display an image that allows users to check the quality of the LED. With a few printers, it was necessary to start a print with a long exposure time and trick some safety features before being able to check the energy output. Three printer manufacturers have safety features or are designed in a way that do not allow users to check their energy output. With these challenges, the total energy output for individual printer manufacturers is not being compared across manufacturers.
Data and Analysis
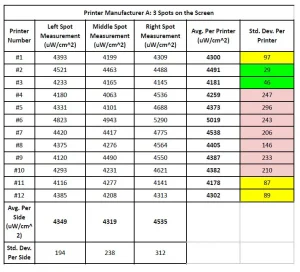
The experiment began by looking at data from Manufacturer A. Testing was performed on a total of 12 printers from Manufacturer A, ranging in age from one month to 12 months and in use from ~10 hours to ~200 hours. When looking at Manufacturer A and the data reported for these printers, it is important to note that the assigned printer number is not significant to the age of a particular printer or amount of time used. The assigned numbers are purely for distinction between printers of this manufacturer within the lab.
Manufacturer A’s printers show a range of variation across the print platform (Table 3). A correlation study for exposure vs. print issues has not been done, and faster chemistries will be more robust with respect to this error. However, based on some calculations for this system, less than 2% is expected to be great, less than 5% to be acceptable, 5 to 10% could possibly start causing issues and >10% probably results in print issues. These percentages may vary due to differences in formulas and printers; however, these calculations could be applied to other manufacturers. For these 12 printers, six or seven of them could have significant print issues across the surface. The variation also is very high from printer to printer, so if it could be very challenging to reproduce a method over these printers.
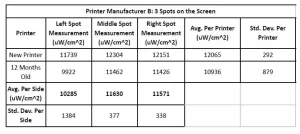
Looking at the data produced by Manufacturer B’s printers (Table 4), it can be seen that an older model had more issues with consistent prints as it aged. Due to this, a new one was purchased. The older printer meets the manufacturer’s specifications (although the specifications do not take into account the changing output of the LEDs as aging occurs), and the new printer is fairly consistent with prints. The data clearly show the new printer has significantly less variation than the old printer (by greater than a factor of three) across the print surface and an even higher difference in irradiance.
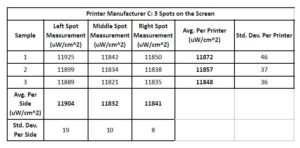
Manufacturer C is the only machine that does calibration of its own LED sources internally. However, the data displayed in Table 5 was a measurement taken with the authors’ radiometer as per the method listed above to maintain consistency with the rest of the collected data. The printer is impressive with respect to the precision of irradiance, as shown through the data in the table.
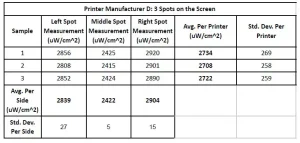
As great example of “you don’t always get what you pay for,” Manufacturer D produces a very expensive printer, and its consistency across the build platform is poor (Table 6).
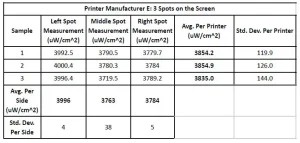
One of the largest printing surfaces comes from Manufacturer E. This printer was less than a month old with minimal hours printed on it at the time of testing. The data (Table 7) illustrates the difficulty with making a large print, and the variation will make it challenging to use the whole surface, especially as the printer ages. Although the variation was within an acceptable range at the time of measurement (less than one month old and fewer than five hours of use), will the variation worse as the machine ages?
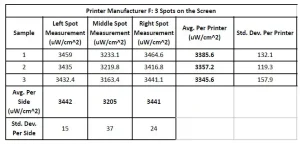
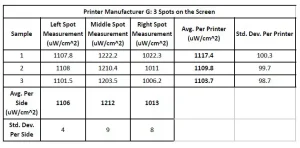
Manufacturer F’s printer is relatively new, and it is ok out of the box with respect to irradiance over the entire surface of the printer (Table 8). Similar to E, concern is present that variation will worsen as the equipment ages. And finally, Manufacturer G – one of the older printers in the lab at over 15 months of age with pre-2020 technology – provides data measurements (Table 9) showing what was expected with respect to the variability due to its age.
Conclusion
In conclusion, when selecting a 3D printer, it is important to understand the machine’s light source output quality and how the source might age in the future. This study has shown that the most expensive 3D printers don’t guarantee a curing source that is the best option – according to the data, money doesn’t necessarily buy quality when it comes to prints.
Having consistent radiometry across the entirety of the screen is important, but also difficult to achieve due to structural differences or age of curing sources. As seen in the data on printers from Manufacturer A, seven of them have significant differences between the middle and edges on the screens.
Understanding the radiometry also can make a difference in print quality and success. The worst-case scenario is that failed prints occur with a failing curing source, but a degraded LED source also might be causing printed models to have different conversion levels if printed on different parts of the print platform – or even a singular model to have different conversion on different areas of its surface if it spans across a print platform. Uneven curing across the entire print also can cause added stress and embrittlement when undergoing post-cure.
After performing this study, some recommendations and guidelines have resulted for people looking to purchase a new 3D printer or create a method for a material. When setting up a method that is consistent for a material on a 3D printer, it’s important to take into account the lowest cure settings that work for the material (not the average or highest) as not all print platforms give good results across the surface.
Manufacturer C, which had the best consistency data, was the only printer tested that had internal radiometry metrics. Therefore, it would follow that printer manufacturers whose machines have an internal option to check the radiometry would be recommended. However, simply having a printer that includes a display, internal test or calibration that a user could use to perform testing themselves also is a good option.
This is the authors’ first in-depth look into the radiometry of the 3D printers to which they have access, and the entire study has been found to be very interesting. Throughout the experiment, questions have arisen that could be the focus of future investigation. These include the following:
- If a printer is producing good prints but there is variation across the surface of the printer, how does post-cure affect the material’s properties?
- Do material physical properties change with the 10% difference in light, or does post cure bring all printed models to the same state?
- The authors’ lab has done work on the effects of over-curing and under-curing materials during development, with negative results experienced when a material becomes over-cured and has embrittlement. Could this be happening to parts if a post process is optimized for prints that have been exposed to less energy from a particular printer?
- What is the correlation between the LED source’s age and how many hours it has been used to print?
Resources
Ledlights.org. 2022. Do LED Lights Dim Over Time? [online] Available at: <http://www.ledlights.org/FAQ/Do-LED-Lights-Dim-Over-Time.html> [Accessed 25 March 2022].
LampHQ. 2022. LED Brightness Degradation: Do LED Lights Dim with Age? – LampHQ. [online]
Available at: <https://lamphq.com/led-degradation/> [Accessed 25 March 2022].
Creality.com. 2022. The Basic Introductory Guide of Resin 3D Printers. [online] Available at: <https://www.creality.com/blog-detail/the-basic-introductory-guide-of-resin-3d-printers>
[Accessed 24 March 2022].
ELEGOO Official. 2022. Types of 3d Printers: SLA vs DLP vs LCD vs FDM. [online] Available at: <https://www.elegoo.com/blogs/learn/types-of-3d-printers> [Accessed 24 March 2022].


