


By Brian Dillman, IGM Resins
The shift from rapid prototyping to durable good manufacture via 3D printing (3DP) steadily has increased the performance demands of the resins used in 3DP. Herein experimental data for the cured properties of formulations based on urethane acrylate oligomers is shown. Tensile mechanical properties, glass transition temperature and cure-induced shrinkage values are related back to the urethane acrylate structure, diluent level and diluent type used in the test formula.
Introduction
3D-printed materials manufactured through a UV-curing process such as SLA and other techniques are demanding higher performance properties in comparison to the rapid prototyping work that initially captured most of the attention and volume of light-cured additive manufacturing. Many performance properties may be targeted for a specific application but, in general, a closer approximation to common engineering plastics normally used to make products through injection, rotational or any other molding processes must be achieved through formulation.
UV-curable materials, such as epoxy acrylates, polyester acrylates and urethane acrylates, will make up the base of a 3DP formulation. The potential performance properties of the cured 3DP material will be limited somewhat depending on which base resin is used. Epoxy acrylates commonly used in hard coat overprint varnish formulas in the printing and packaging market generally produce very hard but also brittle materials. Further, epoxy acrylates often have high color specifications and are known to weather poorly. Polyester acrylates have a broad variety of properties but will suffer in hydrolytic stability due to the abundance of ester linkages composing the substructure of the resins. Urethane acrylates typically have lower color, a broader range of mechanical properties (from very hard to extremely soft) and are the preferred type of acrylate resin for weathering and overall long-term stability. With the range of oligomers available, the urethane acrylate family is the preferred base for 3DP formulations targeting performance characteristics like those of polycarbonate, nylon, polypropylene and other plastics.
All durable goods have one material property that coatings do not necessarily have: toughness. A tough material may be defined as having moderate to high stiffness to hold its shape but also must tolerate some level of impact or other mechanical insults without failing via fracture or yield. There are a variety of specific tests that assess toughness, such as notched impact testing, high speed tensile testing and crack propagation resistance testing (K1C). In addition to the above testing, a simple tensile mechanical evaluation can give a general guide to material toughness. A material with both a high tensile modulus and a high elongation value is considered a tough material. Defining the modulus and elongation values that satisfy the so-called “tough” definition is application dependent and, therefore, can be difficult to nail down.
After reviewing many different application requirements with a broad range of 3DP formulation developers, the minimum for tensile modulus and elongation have been defined, though somewhat arbitrarily. To be considered “tough” in this study, a cured material must have a tensile modulus value of 500 MPa or greater and an elongation value of 8% or more. These minima are the starting points for toughness and, in general, a material with higher values would be considered a tougher material than one that only just satisfies the modulus and elongation values listed above.
Other material properties beyond toughness that are important to consider include water absorption, glass transition temperature, cure-induced shrinkage and degree of cure. In this study, a line of urethane acrylates with a broad range of properties was analyzed in the neat, cured form for tensile and the other properties listed above. The line of oligomers was then formulated with a selection of four monomers at two different levels to provide data to the performance space. Two of the oligomers then were selected for further study, with additional monomers chosen as diluents and higher monomer levels used in order to more closely target typical viscosity ranges used in vat-type 3DP applications.
Materials
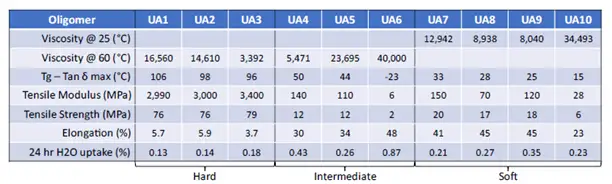
Oligomers: Ten different urethane acrylate oligomers were used in this study with varying molecular weights, substructures and functionalities. The oligomers fall into three distinct categories: Hard, Intermediate and Soft. The Hard oligomers exhibit high Tg values and high viscosities; the Soft oligomers have low Tg values and are low in viscosity; and the Intermediate oligomers have low Tg values, but like the Hard category, exhibit high viscosities. Oligomers are listed in the text using the following notation: UA1, UA2, UA3, UA4, UA5, UA6, UA7, UA8, UA9 and UA10.
Monomers: The following acrylate and acrylamide monomers were used at various dilution levels with the urethane acrylate oligomers: isobornyl acrylate (IBOA), butylaminocarbonyloxy ethyl acrylate (BACEA), caprolactone modified hydroxyethyl acrylate (Cap-HEA), dipropylene glycol diacrylate (DPGDA), isodecyl acrylate (IDA), lauryl acrylate (LA), 2-ethylhexyl acrylate (EHA), phenoxyethyl acrylate (PEA), polyethylene glycol phenyl ether acrylate (4(EO)PEA), tetrahydrofurfural acrylate (THFA), cyclic trimethylol formal acrylate (CTFA), 2-(2-ethoxyethoxy ethyl acrylate (EOEOEA), acryloyl morpholine (ACMO) and N,N-dimethylacrylamide (DMAA).
Formulations: Simplified formulas were prepared using three ingredient types: 1) oligomer, 2) monomer(s) and 3) photoinitiator. The monomer level in the resin blend (oligomer + monomer) was formulated to be 20%, 40%, 50% and 60%. In a limited set of formulations, a blend of monomers was used (those monomers and concentrations are noted in the text). In all cases, TPO-L was used as the photoinitiator due to its ease of mixing and sensitivity at 395 nm wavelength. The concentration of TPO-L was maintained at 0.5 wt%, based on the amount of resin blend in each formulation. Formulas were prepared by mixing in a dual asymmetric centrifugal mixer. Two aggressive mixing cycles were followed by a milder mixing cycle carried out under-vacuum to completely mix all ingredients and eliminate entrained air from the formulation.
Methods and Characterization
The viscosity of each test formula was measured using an RV-type Ametek-Brookfield viscometer fit with a small sample adapter. The temperature was maintained at 25° C during the viscosity measurement using a water recirculation bath. Solid test specimens then were prepared for the following tests: 24-hr Water Absorption, Tensile Testing, Dynamic Mechanical Analysis (DMA), Volumetric Shrinkage (cure induced) and degree of cure via FTIR spectroscopy.
Water absorption and Shore hardness specimens were prepared by curing an approximate 10-gram amount of sample in a 2-inch diameter aluminum pan, resulting in a 5-mm-thick sample puck when full cured. UV curing thick specimens was done by passing the filled aluminum cups under the LED source two times, delivering ~1400 mJ/cm2 of 395 nm to the sample with each pass. The aluminum pan then was removed from the cured specimen, and the specimen was placed in the curing unit upside down and cured using a Hg lamp. After cooling, the samples may be analyzed.

Tensile and DMA test specimens were prepared by curing a 1-mm-thick plaque of test formula. The plaque was prepared by placing the liquid test formula between glass plates. Silicone strips were used to maintain a 1-mm gap between the plates and RainX was applied to the glass surface prior to use to ensure complete release of the plaque from the glass surface. The glass assembly was passed under the 395 nm LED source such that ~1400 mJ/cm2 of UV energy was delivered to the test formula. The assembly then was flipped and passed through the curing unit a second time to ensure maximal cure on each face. The cured plaque was annealed in a 120° C oven for 10 minutes and then cooled to room temperature. Type IV test specimens were cut from the cured plaque using a CNC router for hard materials or a hollow die press for very soft, rubbery materials.
Shrinkage measurements were made using gas pycnometry wherein the liquid formulation density and the cured density are accurately measured. The solid specimens were cut from the 1-mm-thick plaque into about 2-cm2 sections, which then were used in the pycnometry measurements. The degree of cure measured by FTIR was carried out using the liquid formulation and a small section of the 1-mm cured plaque from the same test formula.
Water Absorption
The sample pucks are used to determine %H2O uptake gravimetrically. The pucks are weighed and then submerged in water for 24 hours while being stored at 23 ± 2° C. After storage, the sample pucks are removed, patted dry and then weighed again. The increase in weight is used to calculate the percent H2O uptake in a 24-hour period.
Tensile Testing
Tensile bars prepared as described were conditioned at 23 ± 2° C for 48+ hours prior to testing in accordance with ASTM D618. The tensile testing procedure followed ASTM D638. Using a 34SC-5 single-column Instron tensile tester fit with a video extensometer, the specimens were tested until failure by pulling at a rate of 50 mm/min. The elongation was calculated based on a gauge length of one inch. The tensile modulus was determined by the maximum slope of the stress/strain curve at the beginning of the stress-strain profile. The tensile strength was determined by the maximum stress measured during the tensile test. (In some cases, the yield strength was greater than the strength at break. The greatest of the two values, yield or break, is reported as the tensile strength.) The % elongation was determined by the strain observed at break. A minimum of seven test specimens were used for characterizing the tensile properties of each test formula.
DMA Testing
A TA instruments Discovery 850 DMA was used for characterizing the thermal transitions of all test formulas. ASTM E1640 was followed for Tg determination with a modified heating rate as noted below. The narrow section of the type IV test specimens was used for DMA testing. The test specimen had the following approximate dimensions: 1 mm x 6 mm x 20 mm. The specimen was loaded in film tension clamp, then cooled to -60° C, held isothermal for five minutes and then ramped at a rate of 2° C/min to at least 50° C above the glass transition temperature (maximum tan δ value). The strain oscillation was set to a frequency of 1 hz and a strain rate of 0.05% of the clamp-to-clamp distance. The glass transition (Tg) is reported here as the tan δ max. A minimum of two test specimens were evaluated via DMA. If the Tg values of the two runs do not agree within 5° C, a third specimen was tested. The values reported are the average result of the total specimens measured per test formula.
Cure Induced Shrinkage
An Accupyc II 1345 by Micromeritics Instrument Corporation was used to accurately measure the liquid and solid/cured density of all test formulas. The instrument measures volume via pressure differentials after being calibrated with precise volumetric standards. Irregularly shaped solids as well as non-volatile liquid samples may be measured with a high degree of precision. After obtaining density measurements of the uncured and cured test formulas, the following equation may be applied to calculate the cure induced volumetric shrinkage in terms of percent: % 𝑆ℎ𝑟𝑖𝑛𝑘𝑎𝑔𝑒=(1−𝜌𝑙𝑖𝑞.𝜌𝑠𝑜𝑙.)∗100%
Degree of Cure
A Perkin Elmer FTIR spectrometer fit with a diamond ATR accessory was used to obtain spectra of uncured liquid and cured solid samples of test formulas. The peak area centered on 810 cm-1, associated with vibrations of the acrylic C=C double bond, was measured and normalized to the peak area centered around 1720 cm-1, associated with vibrations of the C=O carbonyl double bond and remains generally unchanged over the course of the polymerization reaction. The conversion of C=C double bonds to polymeric material then can be calculated as the concentration of the double bonds is linearly proportional to the intensity of the absorbance measured in the FTIR spectrum. The following equation can be used for calculation: % 𝐶𝑜𝑛𝑣𝑒𝑟𝑠𝑖𝑜𝑛=( 1−𝐴810,𝑠𝑜𝑙𝑖𝑑𝐴1720,𝑠𝑜𝑙𝑖𝑑𝐴810,𝑙𝑖𝑞𝑢𝑖𝑑𝐴1720,𝑙𝑖𝑞𝑢𝑖𝑑) ∗100%
Results and Discussion
The formulations described in the experimental section were prepared with the goal of achieving tough cured properties, as measured via tensile testing. “Toughness” is difficult to define as it is application specific. Typical tensile properties of tough materials are those with a high tensile modulus and a high strain at break or % elongation. One application may require a modulus of 3000 MPa and an elongation value 12%, while another application may only require a modulus of 1200 MPa but a higher elongation of 150%. For the purpose of this study, the minimum tensile properties for tough materials are 500 MPa for the modulus values and 8% for the elongation at break values. A material with values above these minimum limits would be considered tougher than a material operating at those limits and therefore generally would be preferred.
Starting with a line of oligomers produced by the author’s company, a formulation exercise was undertaken to arrive at UV-cured materials with tough mechanical properties. Relatively simple formulations composed of oligomer, monomer and photoinitiator were prepared and analyzed to investigate the effects of the oligomer, monomer type, monomer concentration and, in a limited set of cases, the cross-link density. Formulations with modulus and elongation values of at least 500 MPa and 8%, respectively, are highlighted as simple starting point formulas for tough applications.
Other properties of interest to 3DP applications include the following: Glass transition temperature (Tg), cure-induced volumetric shrinkage, water absorption and the formulation viscosity.
Properties of Neat Oligomers
The initial survey of cured neat oligomers revealed three categories of oligomers in the set of ten materials: Hard, Intermediate and Soft. The first three oligomers (UA1-UA3) are placed in the “Hard” category for the high modulus and high Tg values. The group of hard oligomers also have high viscosities, which require elevated temperatures for the viscosity measurements when measured with standard spindle-type viscometers. Additionally, the Hard oligomers are trifunctional and therefore develop a higher level of cross-link density in comparison to the Intermediate and Soft oligomer groups. UA4-UA6 make up the “Intermediate” group, which have properties of both the hard and soft categories’ low modulus and Tg values but high viscosities. The “Soft” oligomers make up the final four (UA7-UA10) in the set of 10 tested oligomers. These materials have low moduli, low Tg values and are low in viscosity. The primary difference between the high viscosity oligomers (Hard and Intermediate) and the low viscosity oligomers (Soft) is simply the average molecular weight. There is not a single component in the substructures that drive viscosity increase other than the average size of the molecules making up the resins. See the values for the properties in Table 1.
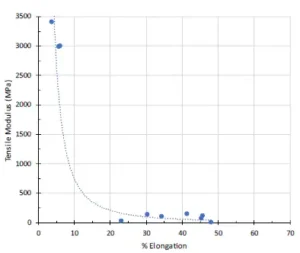
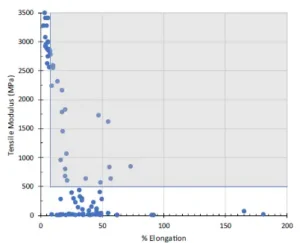
Plotting modulus vs. elongation for the neat oligomers shows a commonly observed trend – that oligomers on their own typically either are hard with minimal elongation or soft with substantial elongation (see Figure 1). None of the oligomers tested meet the tensile criteria to be considered tough. All oligomers require formulation development in order to achieve the desired tough properties.
Simple Formulations
The next stage in the formulation is establishing an approximate property envelope for the oligomers by diluting them with a range of monomers blended at various levels. The four monomers used in this part of the work included IBOA, BACEA, Cap-HEA and DPGDA. This set of monomers gave two examples of hard, or high Tg, monomers with IBOA and DPGDA; two examples of soft or low Tg monomers with BACEA and Cap-HEA; three examples of monofunctional acrylate monomers with IBOA, BACEA and Cap-HEA; and one example of a multifunctional monomer with DPGDA. The monomer levels were 20% and 40% monomer by weight.
The effects of the monomers can be generalized overall for viscosity reduction, water uptake and cure-induced shrinkage and more narrowly within the three groups of oligomers for effects on Tg, and tensile properties.
The cutting power of the monomers varied, with DPGDA providing the greatest viscosity reduction, followed by IBOA, BACEA and finally Cap-HEA. To achieve a workable viscosity of 5000 cP or lower, the Hard and Intermediate oligomers required 40% monomer. The Soft oligomers have a lower viscosity to start with and typically have a viscosity less than 5000 cP with 20% monomer and below 1000 cP with 40% monomer.
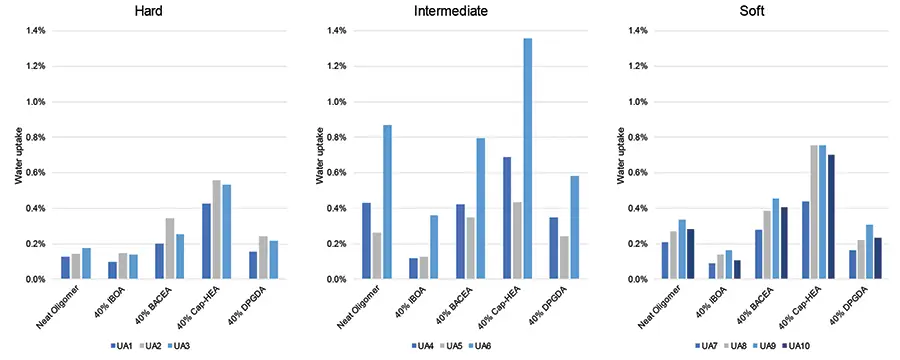
The water uptake is affected by the monomer type with the effect increasing in magnitude with the amount of monomer included in the formula. For durable parts, higher water uptake generally is associated with lower durability, so the lower the water absorption the better. IBOA and DPGDA both reduced the 24-hr water uptake compared to the neat Soft and Intermediate oligomers. For the Hard oligomers, IBOA still reduced the water uptake but DPGDA slightly increased the water uptake. Both BACEA and Cap-HEA increased the water uptake for all oligomer types, with Cap-HEA having the largest impact of the four monomers tested. See Figure 2 for the 24-hr water absorption data for the neat oligomers and the 40% monomer formulations.
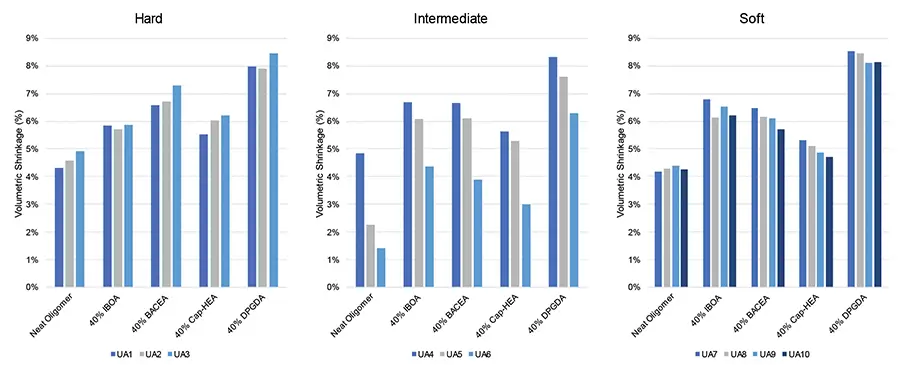
With respect to cure-induced shrinkage, all monomer additions increased the volumetric shrinkage in comparison to the neat oligomer. Cap-HEA had the lowest effect on shrinkage due to the comparatively large equivalent weight. Conversely, DPGDA had the greatest impact on shrinkage due to the low molecular weight and difunctional structure. See Figure 3 for the volumetric shrinkage values of neat oligomers and the 40% monomer formulations.
For the Hard oligomers IBOA and DPGDA, both maintained the high Tg values of ~100° C, while in the case of the Intermediate and Soft oligomers, the Tg is increased above the values of the neat oligomer. Conversely, BACEA and Cap-HEA reduce the Tg of all oligomers except for UA6. In the case of UA6 blended with 40% BACEA, the Tg increases by approximately 17° C (Figure 4).
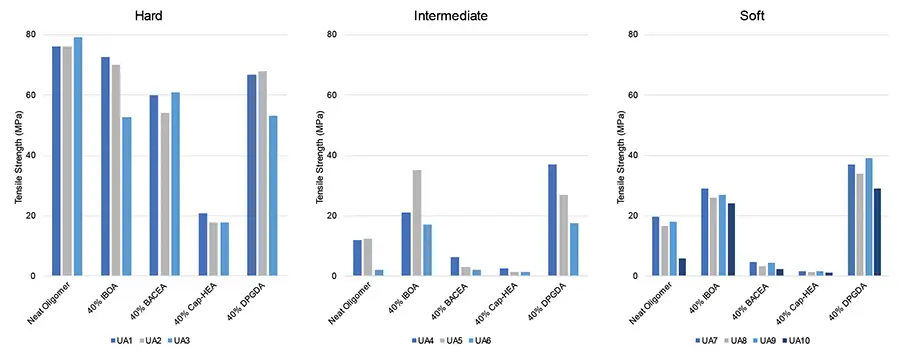
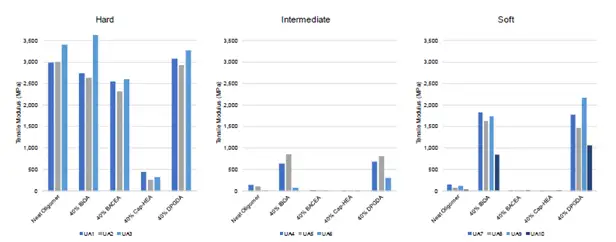
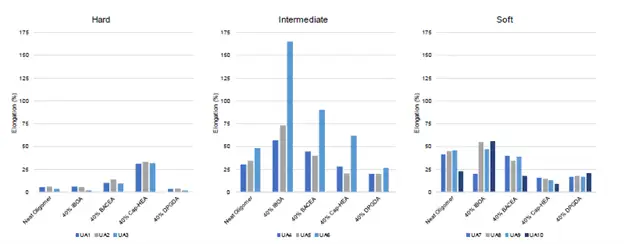
Similar to the Tg measurements, in the Hard oligomer group IBOA and DPGDA maintain the high modulus values of at least 2500 MPa and high tensile strengths of at least 50 MPa. BACEA and Cap-HEA both reduced the tensile modulus and the tensile strength (Figure 5). For elongation, the monofunctional monomers increased the elongation of Hard oligomers in most cases with IBOA maintaining the elongation of neat UA1 and reducing the elongation in the cases of UA2 and UA3. The difunctional DPGDA reduced the elongation across the board. When blended with Intermediate and Soft oligomers, IBOA generally increased the elongation values, BACEA increased or maintained the elongation, and Cap-HEA decreased the elongation at break value, overall having a negative effect on the material’s cohesive strength. The absolute values of the modulus and elongation measurements are shown as bar charts in Figures 6 and 7, respectively.
An example of note is the effect of the BACEA monomer on the Hard oligomer group. At the 40% monomer level, the average tensile modulus of all three Hard oligomer formulations remains high (~2500 MPa), while the elongation has been doubled from an average of only 5% to and average of 11% for the Hard oligomers. The addition of BACEA monomer to all three hard oligomers shifted the cured material properties from hard and brittle to tough.
In surveying the 10 urethane acrylate oligomers formulated with the four above discussed monomers, a total of 90 formulations have been evaluated. 22% of the formulations tested met the tough criteria of modulus and elongation meeting or exceeding 500 MPa and 8%, respectively. The modulus-elongation pairings for all the formulas are highlighted in the modulus vs. elongation plot in Figure 8, with the tough formulas in the grey region.
Two of the oligomer candidates for development of tough materials are UA1 and UA6. UA1 is a high Tg oligomer with high viscosity which may be formulated for toughness by blending it with other low to moderate Tg monomers (beyond BACEA and Cap-HEA). UA6 is an Intermediate oligomer with very low modulus values and also is high in viscosity. UA6 also shows high elongation values in its neat state and in the test formulations with IBOA. UA6 likely will have improved properties when blended with other monofunctional high Tg monomers. To reach the low viscosities needed for many 3DP applications, the monomer level will be increased.
Part 2 of this article will be published in UV+EB Technology Issue 3, 2024.
Acknowlegements
This large study was made possible by IGM Resins R&D, within the Charlotte Applications Lab. Three technicians carried out the bulk of the workload in preparing test formulas and test specimens, and in collecting the substantial amounts of data shown in this paper. The author would like to acknowledge and thank Curtis Watkins for the tireless and consistent work he delivered to make this project successful.


