


By Darrin Leonhardt, chief innovation officer and head of engineering, EIT 2.0
A UV curing line runs flawlessly for two years. Then the lamp supplier changes. The replacement units are the same wattage, the same lamp type, the same rated output. The radiometer reads within 2% of the original baseline. Three days into production, cure failures begin appearing downstream – parts that flex when they should not, adhesives that peel, coatings that never fully harden. The process engineer checks power, conveyor speed and the radiometer on another line. Everything appears normal. A newly calibrated radiometer reads within 2% of the previous one. The meter is not wrong. It measures exactly what it was designed to measure. The problem is that what it was designed to measure is not what the photoinitiator in that formulation requires – and the new lamp’s spectral output, while identical in total power, lands in precisely the wrong part of the 200-280 nm range to drive the chemistry. The broadband number did not change. The bulb change impacted how the formulation cured.
This is the predictable consequence of treating a 200-280 nm wavelength range as a single entity. The UV-C band is one of the most photochemically active regions of the electromagnetic spectrum and one of the most poorly characterized in industrial practice. Over a 15 nm range, the photoinitiator response can decrease by more than half while the radiometer reading is unchanged. Closing that gap does not require a different radiometer. It requires understanding what the source is doing across the full 200-280 nm band – and using that knowledge to interpret the radiometer reading effectively.
The UV-C Band Has Much Going On
While the 80 nm window from 200 to 280 nm is narrow by the standards of visible light, it is photochemically a vast and rich region. In fact, many photoinitiators used in UV curing have maximum sensitivities in the 200 to 280 nm region. While this is well known, the industry limits itself to “what we have always done” and benchmarks short-wavelength (UV-C) curing processes using a sliver of the information that is available.
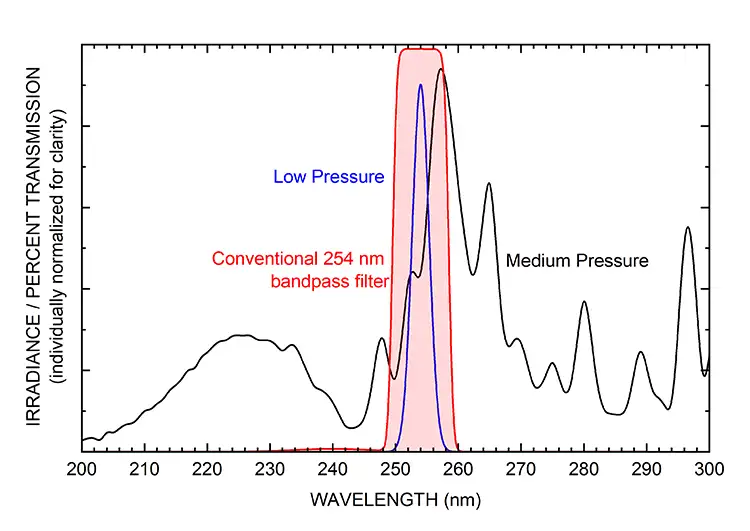
The conventional “UV-C band” is a 10 to 15 nm measurement window suited for the low-pressure mercury spectrum. Optical filtering and measurements of the 254 nm line were well-established in many applications, giving radiometry somewhat of a foothold in the UV industry. However, as UV sources progressed beyond the low-pressure mercury lamp, the spectra changed significantly: The sharp and intense 254 nm line grew and broadened exponentially until the emission was self-absorbed. 1 Additional mercury emission lines at 248, 254, 265 and 270 nm appeared, and plasma reactions provided even shorter wavelength emissions as the plasma discharge power increased (Figure 1). The conventional optical filter still was useable and much more UV was being measured, so everyone was happy. In short, the measurement window outlasted the utility of the lamp.
Qualitatively, the 200-280 nm range is a different measurement – a measurement that makes the reading independent of source type, robust to spectral change and valid across the full range of UV-C photochemistry that modern processes actually use.
Fortunately, atoms don’t lie. The wavelengths of these emissions are unwavering constants. 2 Unfortunately, other components in the system obey their own laws of physics. Quartz and fused silica materials 3 used in bulb envelopes, as well as windows in UV curing ovens, have strong transmission variations below 250 nm – and these variations are temperature- and lifetime-dependent(!). Electrodes slowly degrade, coating the interior of the bulb and decreasing the transmission of UV. And these are issues typical in mercury lamp technology; with the adoption of excimer and LED UV-C sources not centered around 254 nm, the industry needs to see what it is missing.
UV Curing: The Cost of Spectral Mismatch
Photoinitiator absorption is wavelength-specific
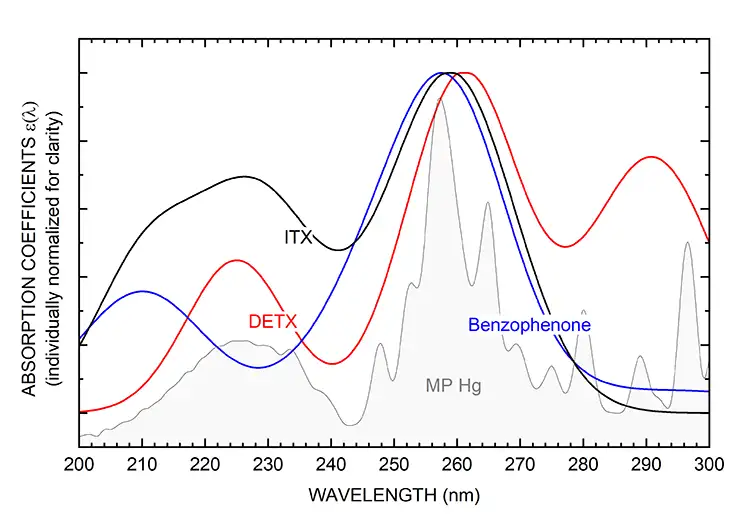
A photoinitiator absorbs a photon and dissociates into radicals that trigger polymerization. The photoinitiator’s ability to absorb at any given wavelength is described by its molar absorption coefficient, 4 ε(λ) – a curve, not a number, that varies across the UV spectrum. Where ε is high, a few photons can drive significant chemistry. Where ε is low, even high irradiance produces little initiation.
In Figure 2, three commercially relevant photoinitiators illustrate how dramatically ε(λ) varies across the UV-C band. 2-ITX (thioxanthone) 5, DETX 6 and Benzophenone 7 were chosen for their widespread use in the curing industry and their high sensitivity in the 250-260 nm range. For comparison, the spectrum from a medium-pressure mercury lamp is superimposed in gray.
The excellent overlap in the 250-265 nm region can be immediately seen. However, looking quantitatively outside the narrow 250-260 nm band captured by the conventional UV-C band, all of these photoinitiators will receive curing contributions comparable to the conventional UV-C band from the much shorter (200-240 nm) and longer (265-300 nm) wavelengths. The traditional UV-C band only accounts for half of the useful energy in this case. Consider a scenario where an expensive fused silica plate (transmissive down to 200 nm) is replaced with a lower-cost plate of common quartz (transmissive down to ~ 240 nm); the traditional UV-C radiometer would hardly notice the loss of UV energy, while the process will have lost approximately half of the energy!
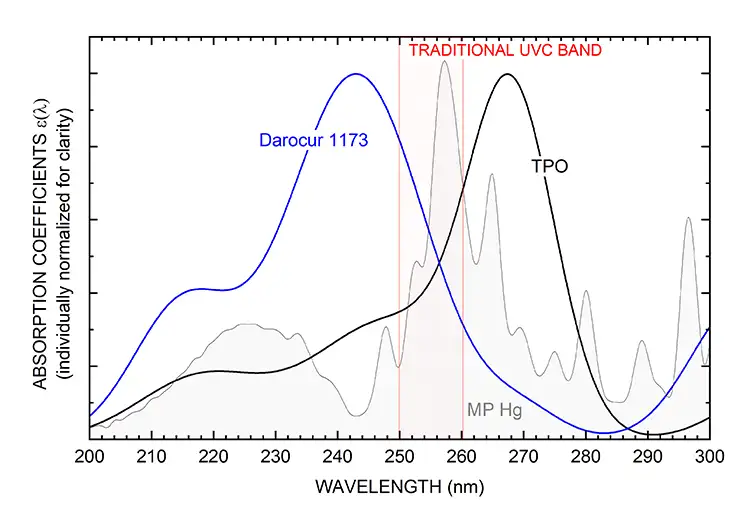
The photoinitiators in Figure 2 can be considered as an ideal case for the present-day process measurement. The spectral overlaps were favorable, and other possible system changes weren’t a concern. Now consider photoinitiators not peaked at 254 nm. Figure 3 provides ε(λ) for Darocur 1173 8 and TPO 9, with the medium-pressure mercury lamp spectrum (gray) and the traditional UV-C band (red) that covers the 254 nm low-pressure mercury emission. It can be seen that the majority of the reactivity between the photoinitiators and the lamp primarily is outside of the traditional UV-C band. Since the measurement associated with this band minimally represents the reactivity of the system, changes to the curing system may go completely unnoticed if relying on this measurement band alone. The traditional narrow-band radiometer is constitutionally incapable of reporting the out-of-band wavelengths that provide most of the curing activity.
Why the Measurement Window Determines Process Fate
The measurement window defines what a broadband radiometer tells us about a process in the UV-C range. The traditional UV-C band of 250-260 nm is measuring a sliver of the UV-C region and treating it as representative of the whole. For a low-pressure mercury lamp emitting almost entirely at 254 nm, that assumption is reasonable. For any other source – medium-pressure mercury, UV LED, Far UV-C excimer – it is not, and the consequences are directly quantifiable.
The examples here make the case directly. For a process using a medium-pressure mercury lamp with DETX, a radiometer measuring the traditional 250-260 nm window captures only 35% of the active dose being delivered to the surface across the entire photochemically active 200-280 nm band. The remaining 65% – driven by the out-of-band lamp emissions that align with DETX absorption bands – is invisible to the traditional narrow-band instrument. Extending the measurement window to the full 200-280 nm band fundamentally changes this issue. A radiometer that measures and is calibrated across the complete UV-C band captures the contribution of every lamp line to every PI absorption band simultaneously. Its reading reflects the entire contribution from the lamp to the formulation rather than a small fraction of it. When there is a natural (or unnatural) variation in lamp output, aging behavior or line-to-line intensity ratios, it is frequently at the shorter wavelengths, and the measurement below 250 nm can be the early warning sign. A 200-280 nm instrument sees these differences directly, making a 200-280 nm broadband radiometer a genuinely capable process-control instrument. And it is only possible when the measurement window is wide enough to see the entire physics of the lamp source.
Conclusion
The traditional narrow UV-C band centered at 254 nm is not a single photochemical entity unless a single-wavelength lamp source (such as a low-pressure mercury lamp) is being used. A radiometer that measures across the full 200-280 nm band does not merely collect more data – it measures a fundamentally different and more complete quantity. It is the actual energy driving real chemistry that a traditional narrow UV-C band radiometer is incapable of reporting. Customers who use a broadband 200-280 nm measurement do not simply get a better number; they get the right number for the first time. For UV curing, the consequence of the traditional narrow UV-C band is process failure that looks, from the radiometer measurement, like normal operation.
With a wider variety of light sources and growing applications in the 200 to 280 nm range, the solution is not a different instrument for every process or light source. It is using known spectral data and reliably measuring a broader UV-C range to properly connect the measurement to the process. Additionally, the broader window unlocks early warning of lamp aging, source-independent calibration validity and the ability to qualify a new LED source without re-engineering the process. A broadband radiometer built on that foundation is a precise, practical and trustworthy process monitor.
EIT 2.0 is working to redefine the UV-C band because of customer requests and the challenges that have been seen from the “always done it that way” approach. The technology to carry out UV-C measurement with uniform response from 200-280 nm recently has become a reality. A “new UV-C” band will be a new way of thinking and may require reevaluation of cure windows.
References
- Holstein T. Imprisonment of resonance radiation in gases. Physical Review 72(12):1212–1233, 1947.
- NIST Atomic Spectra Database. https://physics.nist.gov/asd
- Heraeus Conamic. Lamp Materials: Quartz Materials and Fused Silica for Lamp Applications. Heraeus Quarzglas GmbH & Co. KG, Hanau, Germany. Publication no. HCA-PTN-LM_8.2/EN. April 2021.
- Decker C. Prog. Polym. Sci. 21(4):593–650, 1996.
- Arkema/Sartomer. Speedcure 2-ITX product catalogue. 2022.
- Arkema/Sartomer. Speedcure DETX product catalogue. 2022.
- Polymer Innovation Blog. UV Curing Part 2: A Tour of the UV Spectrum. polymerinnovationblog.com, June 2020.
- BASF Technical Data Sheet: Darocur 1173 (Omnirad 1173).
- Fouassier J-P, Lalevée J. Photoinitiators for Polymer Synthesis. Wiley-VCH, 2012.

Dr. Darrin Leonhardt received his Ph.D. in 1995 from the University of Maryland in chemical physics focusing on laser spectroscopy and ultracold collision dynamics. After completing an NRC Postdoctoral Fellowship in the Naval Research Laboratory’s Chemistry Division, he joined NRL’s Plasma Physics Division as a Research Physicist to continue work on novel plasma sources and their spectroscopies. In 2007, he joined Fusion UV Systems (presently, Excelitas) as Senior Scientist and progressed to Director of Research (US)/Head of Innovation Asia, where he led global multidisciplinary R&D teams. Dr. Leonhardt joined Euclid Techlabs in 2020 to champion cutting-edge innovations with customers in the electron microscopy and particle accelerator communities, bridging the research and commercial groups. In September of 2024, he joined EIT 2.0 as their chief innovation officer and head of engineering to lead the development of new UV measurement products. Dr. Leonhardt holds over 50 international patents and 60 papers/proceedings articles while providing over 100 author/co-authored presentations at a broad range of international trade and technical conferences. For more information, email dleonhardt@eit20.com or visit www.eit20.com.