


UV LEDs with peak spectral outputs between 365-405 nanometers (nm) are increasingly being used to cure adhesives, but converting a process from mercury to LED may involve more than “turning on” an LED and “turning off” a mercury source. It is important to work with your supplier/formulator to test, evaluate and – if needed – make changes to the formulation.
Three parameters
A cake recipe provides temperature/power (350°F) and time (30 minutes) values. It assumes a “standard oven” versus a convection or microwave oven. A UV recipe needs to provide power, time and be specific about the source (oven) type. For UV applications, the parameters include:
- Power: Irradiance (i.e., intensity) is the power of the UV LED source arriving at the cure surface. Irradiance is important for proper adhesion, penetration and depth of cure of the adhesive. Irradiance is measured in Watts/cm2, and LED manufacturers typically specify their UV LED output based on the value at the array’s optical window or “glass.” It is important to understand how the irradiance changes based on power settings, distance and cleanliness of the optics window. A profiling radiometer can help determine how the UV LED performs at different heights above the substrate.
- Time: Energy Density (sometimes called “dose”) is measured in Joules/cm2 and incorporates time (1 Watt for 1 second = 1 Joule). The energy density is important for the complete cure of the adhesive.
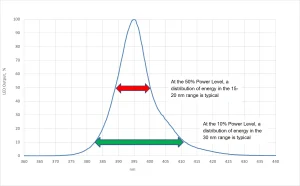
- Source Type: We don’t have a “standard oven” in curing and the UV source needs to be specified. For UV LEDs, this includes the peak center wavelength (CWL) and tolerance (most often ± 5 nm). The tolerance allows for variations in how the individual LED diodes are screened and selected (binned). The peak output for a 395-nm LED is expected to fall between 390-400 nm. The spectral distribution widens to 15-20 nm at the 50% power level and to 30+nm at the at the 10% power level (see Figure 1).
LEDs are not created equal
Using an LED in a power class slightly above what is required can enable the LED to run at a slightly lower power level (i.e., 75% vs. 100%), potentially increasing its useful life. It is critical to make sure that the LED selected delivers the needed energy density (J/cm2) for the process or application based on specific requirements for the exposure/cycle time or line speed.
Test and qualify between two different LED brands and/or even different models of LEDs within the same brand, especially if the process window is tight. The power and energy density can vary from brand to brand and/or model to model. The differences between two LED arrays can also be spectral. Assuming the ± 5 nm binning tolerance is correct, one 395-nm source could have a CWL of 390 nm, while the other is at 400 nm. Could this make a difference? Maybe, but probably not. Despite the stated specification, not all LEDs wind up binned to the ± 5 nm level. We have measured LEDs with a CWL well outside the expected values.
Irradiance values must also be taken into consideration when undertaking a source switch. Is the stated irradiance (W/cm2) value theoretical (calculated) or actual (measured)? If measured, clarify the measurement point and instrument used. The power delivered to the substrate is normally less than the power measured at the quartz LED window.
The energy density (J/cm2) value delivered from two LED sources can vary widely based on array design and size/number of diodes; this is a key difference that needs to be understood. Be careful if the LED manufacturer only talks about watts instead of discussing both watts and joules.
Additional considerations include optics and heat. Do the LEDs have optics that change the way the energy is distributed to the cure surface? An LED array’s heat management can impact cure, along with the lifetime and stability of the LED. How is the unit cooled (e.g., air or water)?
Why measure?
Measuring UV LEDs allows users to save time and money by establishing, maintaining and operating in a defined process window; reducing scrap and increasing product yield; confidently transitioning the process from the lab to production; and providing a certificate of conformance if required by the end user.
In terms of production, measuring UV LEDs enables users to uncover operator errors and process parameter changes, such as adjustments to applied power, speed/exposure time and/or LED height. Measurement also helps drive maintenance programs, identifying LED output changes or quartz window contamination. If the process is not working or has changed, measurement helps facilitate troubleshooting. This includes the premature failure of a component (e.g., power supply, cable, LED array) in the system.
Adhesive suppliers and formulators can provide cure targets, which serve as starting points and can vary widely. The target values require additional work to allow users to establish and document a process window for their application prior to starting production.
Radiometer selection and use
For accurate values, select a radiometer with both a flat response (matched to the peak output of the LED) and a wide enough response to capture all LED energy. Instrument manufacturers will share if their instrument response is matched to the LED source. Make sure the instrument size will work in the available space in the process.
There are two approaches to radiometer responses – narrow band or wide band – with the instrument manufacturer determining the width and shape of each band response. To obtain accurate LED readings, it is important to use a radiometer with a response as flat as possible over the ± 5 nm CWL range of interest. Optically, it is easier to achieve a flat response over narrower bands. Instruments perform best when the calibration source is the same as the source the instrument will measure.
A wide-band radiometer has a response approximately 100-200 nm wide. In most cases, a wide band allows the user to have one instrument, with one irradiance value and one energy density value. This makes it easy to use and understand. The shape and overall flatness of the optic response over the 100-200 nm range is not as easy to control with a wide-band approach. A wide-band response will normally pick a source type and a point somewhere along the 100-200 nm instrument band for the calibration point, with the values measured most accurately at that point.
A narrow-band radiometer has a response approximately 10-70 nm wide. Instruments with narrow-band responses have been used with mercury-based sources, allowing the user to independently monitor the shorter UVC energy responsible for surface cure and the longer UVA or UVV responsible for through cure and adhesion. The shape and flatness of a narrow-band response can usually be controlled better. If LEDs with different spectral outputs are used, a narrow band approach requires an instrument for each LED band or a multiband LED instrument. Narrow-band instruments will use a calibration source that closely matches each type of source being measured. This and the flatness of the response can lead to better instrument performance.
It is important to verify that the instrument dynamic range is optimized for the LED. After all, using a truck scale to weigh an infant does not provide accurate results. The same is true of using an instrument optimized for low-power sources to measure a high-power LED source. The readings can exceed the range of the instrument and “peg it” so that each reading looks consistent. The width (not length) of a typical LED (1 in./25.4 mm) is smaller than the width of a typical mercury system (6 in./152.4 mm). In a moving application, the time the substrate spends under the UV is normally less with an LED than a mercury system. The same is true of the radiometer. Verify that the sample rate of the radiometer will allow the collection of an adequate number of samples under the LED at the speed the data is collected. For non-moving, long-duration static exposures, the sample rate is not as much of a concern as the instrument temperature.
While LEDs produce less thermal transfer than mercury-based systems, they are not heat free. On static LED exposures, monitor radiometer temperature so it does not exceed recommended temperature limits, and let the unit cool between readings. If the radiometer is too hot to touch, the unit was too hot to measure.
LEDs have thousands of individual point sources. Positioning the instrument optics at different positions under the LED can lead to slight differences in the readings, especially if they are extremely close to the quartz window of the LED. For consistent results, collect the data in a consistent manner. Finally, users should follow the manufacturer’s guidelines on how to use, care for, and clean the instrument. Keep in mind that radiometers need periodic calibration and service.
Controlled results
UV LEDs work well to cure adhesives in many applications. For the best results, consider the variables associated with the LED source and the proper measurement tools to use to understand, maintain and control the process.
 Jim Raymont
Director of Sales, EIT LLC
jraymont@eit.com

polymerizations")

