


Inspiration for this column came while visiting friends in Florida. It hit not while soaking up UV photons at the pool, but when helping mount two TVs and speaker bars. Once we found the wall studs, mounting the TVs was straightforward. We creatively overcame the missing hardware for the speaker bars with a trip to the hardware store. Extra time was spent gathering tools from multiple locations, and the project would have been easier with a few additional tools. I also made a mistake in my measurement calculations, which resulted in a “do over” for one of the speaker bars. What are the parallels between this “simple” home project and UV LED measurement?
Key to Success #1: Organization
Home Project: We went to the hardware store with multiple approaches in mind for mounting the speaker bars. Fortunately, only one trip was needed.
UV LED Measurement: With a UV LED system, it’s important to be organized and ensure the following:
- familiarity with the LED source, how to operate and how to maintain it;
- starting guidelines from the formulator are available, if applicable;
- goals are understood (are you doing an initial equipment evaluation, comparing different sources or trying to troubleshoot an existing production line?); and
- what will be used to determine success?
Key to Success #2: Proper Tools
Home Project: Having the proper tools, including a socket set and smaller screwdrivers, would have allowed us to enjoy an extra hour or two of pool time.
UV LED Measurement: The proper tools are needed to measure the LED. It will save time and avoid misleading results, including expensive downtime on the production line.
Bandwidth Response
Match the instrument response to the source. The EIT UV-A, UV-B, UV-C and UV-V bands are designed and optimized for mercury-based sources. You will get numbers on the broadband instruments when they are used on a LED, but chances are the numbers will not be accurate and vary source-to-source and instrument-to-instrument.
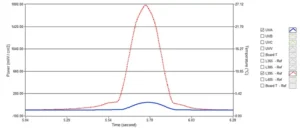
A 395 nm LED was measured with a band (EIT L-395) designed for LEDs and a band (EIT UVA) designed for mercury sources. The L-395 band measured 1785 mW/cm2 and 385 mJ/cm2. The UVA band, which was not matched to the source, measured 134 mW/cm2 and 27 mJ/cm2. The two readings are illustrated in Figure 1. The L-395 band is red and the UVA band is blue. There is clearly a huge difference in the measured absolute values with the data collected by the UVA values being vastly under reported.
Using an instrument with a broadband response to measure an LED can also lead to greater variations when two different LEDs are measured or when two different broadband instruments are used.
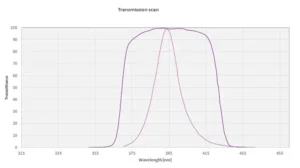
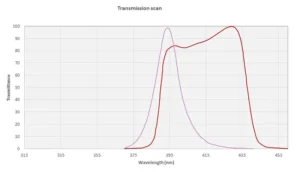
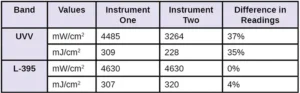
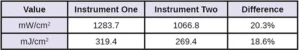
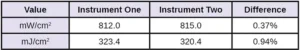
Table 1 shows UVV and L-395 data from a different 395 nm LED source. Two EIT broadband instruments with UVV were compared to two EIT LED instruments with the L-395 band. The UVV band values show much greater variation between the two instruments because the optic response is not matched to the output of the LED source. This mismatch concept is further illustrated in Figures 2 and 3.
Dynamic Range
Understand the suggested operating range of your instrument. It is easy to over range a broadband instrument when it is used on a high-power LED. The instrument can ‘max out’ so that each measurement looks extremely stable. Also pay attention to the low end of the operating range. Using the instrument under range can lead to variations in the Joules, especially on long runs.
Key to Success #3: Record the Data
Home Project: The advice for home projects is to measure twice and cut once or, in my case, measure twice and drill once. Writing down and double checking my calculations may have avoided a time-consuming error.
UV LED Measurement:
- Record both Joules and Watts. Does the measurement count if you do not accurately record the values?
- If your instrument can measure and save the irradiance profile (Watts as function of time), use it to your advantage.
- Record other key variables including LED power level, line speed and height.
- Take multiple readings (three) if you are trying to identify and narrow down issues with the source, process, equipment, or instrument.
Key to Success #4: Measurement Techniques
Home Project: Measure twice and drill once.
UV LED Measurement: Consistent results happen when you collect data consistently.
Disable
Disable or avoid infrared (IR), thermal or ink/coating sections of your process.
Source Heat
LEDs are cooler than broad band sources but still have heat. If needed, let your instrument cool between readings. Determine if your instrument has an internal temperature monitor and do not exceed the operating parameters. Repeated, slow long runs on high power UV LED systems without letting the instrument cool between runs can damage the radiometer and/ or give inconsistent results. A general rule of thumb: If the instrument is too hot to touch, it is too hot to measure.
Sampling
Understand if your instrument has an adjustable sample rate and if it needs to be adjusted based on your line speed. If comparing data between locations, confirm the same instrument conditions.
Instrument Placement
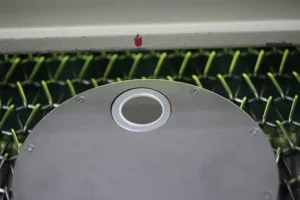
On a conveyor, align the units and optics on the conveyor so that they measure the system in the same exact spot. A small index mark (Image 1) can assist. For critical measurements and calibration of units, we use guides and fixtures.(Image 2). In a chamber, place the instrument in the same location each time.
Additional Data Collection Hints
-
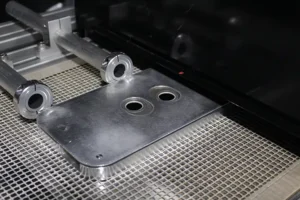
Image 2. For more critical measurements,
a fixture can be used to place the instruments in the same location each time.On wide LED systems, consider measuring in multiple places across the width of the conveyor.
- If you are comparing the results between two radiometers, space the radiometers by at least 12 inches (30 cm) if sending them one after the other.
- Multiple Sources: If you have multiple LEDs, you may need to measure one at a time with a radiometer that provides all information on the display. A profiling radiometer may allow you to measure all sources at once and use the software to ‘see’ the contribution and performance from each LED.
- Measurement Frequency: Determine what works for your process.
Key to Success #5: Time/Patience
Home Project: I have found that most home projects take more time (double?) than originally expected. Patience is a key to getting things done. Anytime I see ‘easy to assemble’ in the directions, I allocate triple the time stated to complete the task.
UV LED Measurement: On LED systems, allow time for the LED system temperature to warm up and stabilize before you take measurements. Avoid human error by double checking and confirming the desired LED power level, line speed and height settings before taking a reading.
Key to Success #6: Proper Care
Home Project: The job is not finished until the tools are put away and any mess that you made is cleaned up. Do any of your home tools require cleaning or service?
UV LED Measurement:
Source
Follow the maintenance recommendations for LED, including the cleaning of the quartz window and changing any air filters. If your LED is water cooled, follow the manufacturer’s maintenance instructions.
Instrument
- Optics Cleaning: Refer to manufacturer’s guidelines for cleaning guidelines of the optics.
- Instrument Handling: Manufacturers work hard to design durable measurement products. Please handle and treat your radiometer as a sensitive electro-optical instrument. The instrument is not designed to be coated, dropped or abused.
- Calibration: For best performance, your instrument needs periodic service from the manufacturer or manufacturer authorized service center.
Consistent data collection and measurement techniques combined with proper care and cleaning of a radiometer are illustrated in Tables 2 and 3.
Summary
Proper measurement of a UV LED is like a home project. Make sure you are organized, have the proper tools for the job, record the data, use the tools as intended, use consistent techniques, and maintain the tools. Be patient and allow extra time to complete the project.
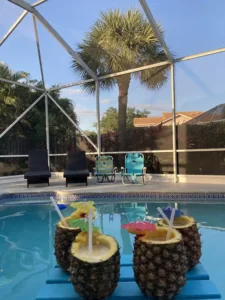
Parting Thought: With this home project, there was a refreshing pool and cold beverage when we finished (Image 3). The TV and speaker bars are still in place, and I have secured an invite for next year.
 Jim Raymont
Director of Sales
EIT 2.0 LLC
jraymont@eit20.com


