

Imagine if a UV process generated a dating profile looking for a radiometer:
UV process ISO of a committed, stable, long-term, quality relationship. Prefer a consistent and controlling partner that can point out changes, flaws and/or tell me when I need to change. Need to have a quick response and be good with numbers. Forget long walks on the beach! I want long periods of boredom where nothing changes once our relationship is established and documented. You need to be tough as you will be kept in the dark, followed by exposure to extremely bright light and heat. This is an unconventional relationship with multiple partners (substrate, formulator and equipment suppliers). Requesting you stay calibrated per the manufacturer’s recommendations. Have been known to pray when the product is not curing. Profiling radiometers seem to understand me better. Let’s meet for a quality relationship, save time and make money together!
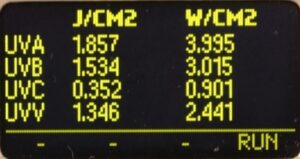
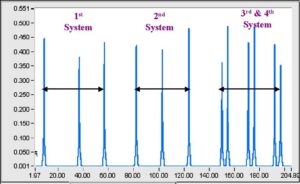
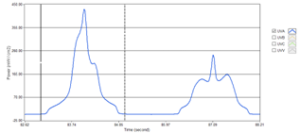
Most commercial radiometers report energy density (Joule/cm2) and irradiance (Watts/cm2) values. In Figure 1, the energy density values (J/cm2) reported for each band (UVA, UVB, UVC, UVV) are the sum from all sources the radiometer passed under. The irradiance value (W/cm2) is the peak value from the most intense source. With a single UV source, this information is useful.
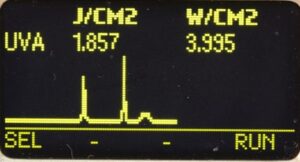
When run under multiple sources, the displayed “values” may be misleading. The values in Figure 1 are from three different UV sources whose individual irradiance and energy density values varied considerably. (See Figure 2) The peak irradiance value displayed is from the most intense source, and the energy density value is the combined Joules from all three sources. With a standard radiometer, users would need to measure each source individually, allowing time for each source to warm up and stabilize. This can be time consuming, especially if there are multiple sources.
Profiling radiometers present different options. Instruments with displays can show the relative intensity, often in low resolution, but still have one energy density value. Profiling radiometers that transfer the data to a computer allow users to calculate the individual irradiance and energy density values from each individual source, after one quick pass, minimizing valuable production down time.
Note: This article focuses on the profile shape more than the actual individual numerical values. In the Figures below, the X Axis is time, left Y Axis is Watts/cm2 and, if present, the right Y Axis is temperature. All images courtesy of EIT 2.0 LLC, unless noted.
What are the benefits of a Profiling Radiometer?
Profiling units quickly and easily identify the following:
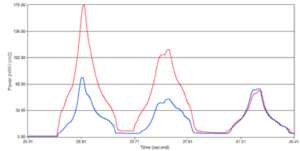
- The number of sources, individual performance and source type: Figure 3 (UVA = blue and UVV = red) shows three sources with vastly different output. Based on the ratio of UVA:UVV, the first two sources are mercury-gallium bulbs and the third source is a mercury bulb. The output drops from the first to the third source.
-
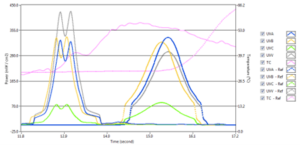
Figure 4. Lamp focus conditions and changes to the focus: Figure 4 shows two sources. The first source (left) is mercury-gallium based on the UVA:UVV ratio. It is a non-focused source based on the characteristic “double peak,” which often results from a physical position change (lamp to substrate, substrate height itself and/or change in the position of the bulb to the reflector). Non-focused sources often are used to control process parameters, including product gloss. All things being equal, a non-focused source normally has lower irradiance value. This could cause issues if the process was designed to have a focused source. The second source is a focused mercury source. Look at the balance between the UVA and UVB. The graph also shows the temperature profile with the values on the right Y Axis. The data were collected with a thermocouple attached to an EIT PowerMAP II. The temperature peaks a second or so past the UV source.
 System Uniformity: Profilers allow users to easily check the uniformity of their system across its width. Figure 5 shows a 48″ (122 cm) wide system with four lamps in a single/single/double lamp pattern. Each lamp was measured on the left, middle and right side, and the profile shows substantial variation along the width of the source that could lead to inconsistent curing.
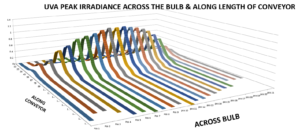
Figure 6. (Image Courtesy Jenton International) Troubleshooting to improve the uniformity should include checking the position of the lamp relative to the reflector, lamp bowing, uneven cooling/airflow and/or incorrect reassembly after maintenance. A quick check after maintenance will allow the user to quickly identify the improvements.Figure 6 was generated in Excel from exported data from 21 passes under a lamp at 3″ (7.6 cm) intervals. The drop at either edge illustrates the importance of having the source slightly wider than the product being cured.
-
Figure 7. Process Speed Variations: Figure 7 shows an LED measured at different speeds. The files were aligned in PowerView III based on the peak irradiance (W/cm2) values. The peak irradiance values are similar while the “area under the curve” or energy density (J/cm2) values are much greater for the slower process speed.
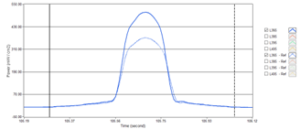
Figure 8. -
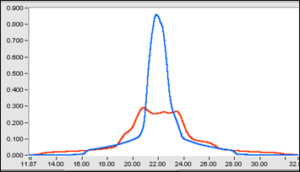
Figure 9. Height Variations: A profiling radiometer will allow users to see the impact of moving the source to different heights above the cure surface. Figure 8 shows an LED array, and Figure 9 shows a mercury source measured at different heights. The distance, system design, source position, reflector shape, secondary optics and shielding around the source can impact how the UV is delivered to the cure surface with changes in height.
-
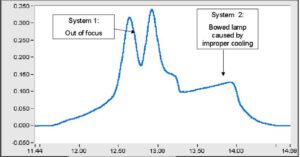
Figure 10. Identify and address maintenance needs: Figure 10 shows two lamps that have changed significantly since they were first installed. Profilers paint a picture to help address maintenance issues – hopefully, before they impact product quality.
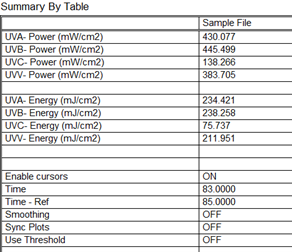
- Individual source performance: Profilers allow users to quickly determine the irradiance and energy density values from an individual source in a multi-source system. Figure 11 shows the UVA profile from a five-lamp system. Figure 12 is a table that shows the total irradiance (power) and energy from all five sources. The values are based on data between 0 and 107.65 seconds.
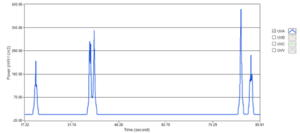
Figure 11. 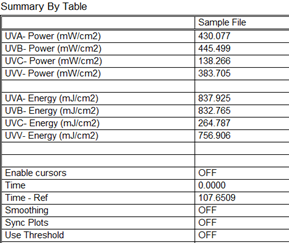
Figure 12.
Figure 13 shows a zoomed-in view of just Lamps 4 and 5 from Figure 11. Cursors are placed on either side of Lamp 4. The UVA irradiance/power (430 mW/cm2) and energy (234.4 mJ/cm2) values from just this lamp are shown in Figure 14. The values are based on data only between 83.0-85.0 seconds. The cursors easily can be moved around to analyze each lamp in the system.
Summary
Profiling radiometers offer multiple benefits over “numerical” radiometers. They paint a picture and allow users to quickly zero in on the portion of the UV line that needs maintenance to keep production running. This ultimately saves time and money. Readers of this column should check with the manufacturer of the numerical instrument currently used to see if it can be upgraded to a profiling radiometer.
If readers are looking to purchase a profiling radiometer, start with the following questions:
- Bands: What optics bands need to be measured? Does the temperature also need to be profiled?
- Memory: How much time is needed to collect data, including multiple passes to assess line uniformity? Understand the memory and how much data/time a profiling radiometer can collect and store.
- Sample Rate: How fast is the line running? Faster production speeds require faster sample rates to ensure good resolution. Match the process speed to the sampling rate of the instrument.
- Software: How easy is the software to use? Can potential buyers try the software ahead of making a purchase?
- Support: Understand the level of support and if training is available.
Parting Thoughts
I am used to measuring (swiping) the left, middle and right sides of UV systems. Special thanks to the under-30 team at EIT for helping me understand the differences in swipe direction in dating applications. Hopefully, you will give this quarter’s column a swipe right (like) or swipe down (super like).
 Jim Raymont
Director of Sales
EIT 2.0 LLC
jraymont@eit20.com


